Triangles Chart Patterns
Chart patterns are an outcome of behavior of all the market participants put together. Since human behavior tends to repeat itself, the chart patterns are repetitive. A triangle is one such continuation pattern, which develops often in a chart. Depending on the sum of all emotions (greed, fear, happiness etc.,) of market participants, the pattern develops into an ascending, descending or symmetrical triangle. Through proper interpretation of a developing triangle pattern, a binary options trader can trade the price break out with relative ease.
Identifying an Ascending Triangle Pattern
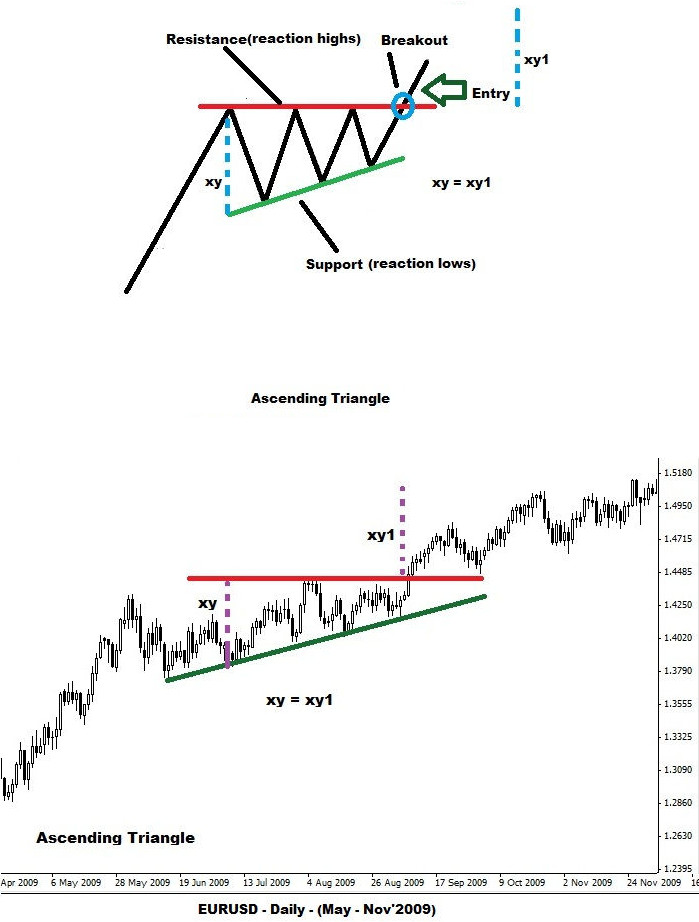
An ascending triangle pattern indicates prevailing bullishness in trend. Obviously, being a continuation pattern, an ascending triangle develops after an uptrend in the price. The volume declines when the triangle pattern develops and rises during the breakout. A horizontal line connecting two or more peaks (reaction highs) of similar height forms the resistance. Likewise, an ascending trend line (indicating bullish bias) can be drawn by connecting the successive reaction lows. It should be remembered that the recent lower high should not be lower than the prior recent low.

The pattern is confirmed once the price, aided by a rise in volume, breaks above the resistance. The probable target price is calculated by adding the pattern’s widest distance to the break out price point. It takes anywhere between few weeks and months for the pattern to complete. Once the price
Setting up a Binary Options Trade with Ascending Triange
1min / 30min / 1hr options
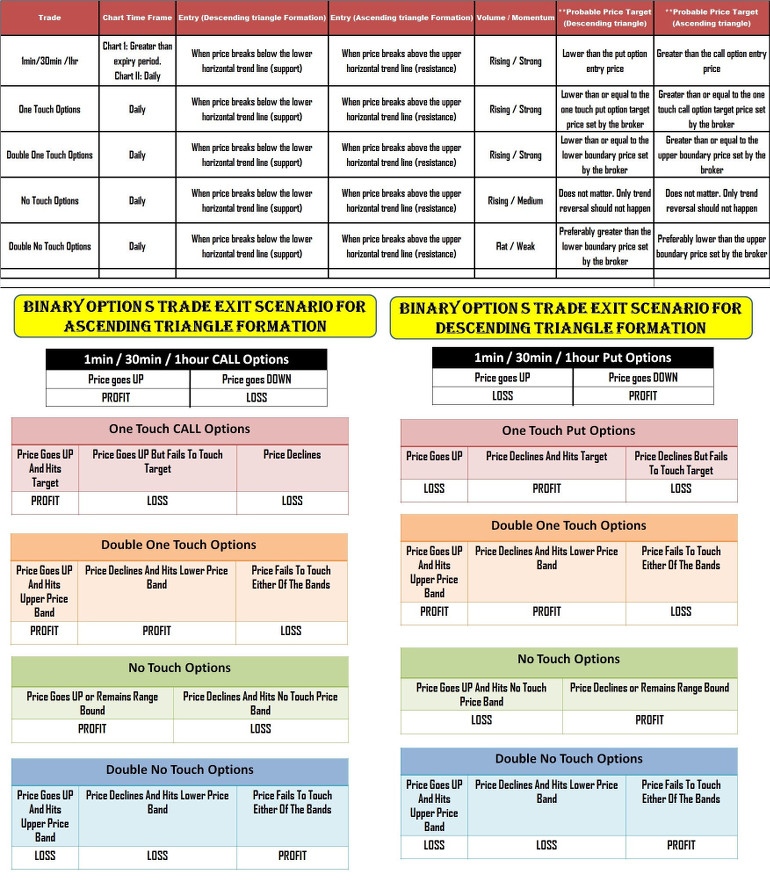
A binary options trader can purchase a buy option once the price breaks above the horizontal line (resistance) of the ascending triangle. The volume should rise when the price breaks above the resistance. Additionally, the momentum should remain strong during the breakout. A trader should use the daily time frame to identify an ascending triangle pattern and preferably the next higher time frame (in comparison to the expiry period) for deciding the entry price. Thus, a binary options trader should preferably use a daily and 1hr time frame to trade a binary options contract with 30min expiry period.
If the volume is not considerably higher after the breakout then a reversal below the point of entry can happen. If so, the contract will expire out of money.
One touch call option
A one touch call option contract can be bought by a binary options trader as long as the probable target price is higher than the one touch target price set by a broker. Additionally, the breakout above the resistance should happen with remarkable volume and complimented by a strong momentum. If the volume is not higher in comparison to the volume during the formation of the ascending triangle pattern then the price may not hit the one touch target price. In such cases, the trade will result in a loss.
No touch options contract
If the breakout above the horizontal trend line of an ascending triangle pattern happens with a commendable volume (plus strong momentum) then a trader can safely purchase a ‘no touch options contract’. As long as there is no reversal triggered by unexpected news, the price will stay above the broken resistance (which by then would act as support) thereby leading to a profit from the trade. Since there is no target price to be achieved, a trader need not worry as to how far the price rise would be. A price reversal initiated by unexpected news would result in the contract expiring out of money. Provided the volume and momentum conditions are satisfied, a no touch options contract is arguably the safest bet for a binary options trader.
Double one touch option
A binary options trader, under the following conditions, can purchase a double one touch options contract after the price breaks above the horizontal trend line.
When there is a high impact news announcement scheduled before the expiry period of the binary options contract then it is wise to purchase a double one touch options contract. If the news favors further uptrend in price then the upper boundary price target set by a broker will be hit. On the other hand, negative news resulting in a price reversal will see the violation of the lower boundary target price. If the news halts the price movement then the trade will result in a loss.
Similar to other options contract discussed earlier, the volume and momentum scenario should favor a further uptrend. Only then a double one touch options contract can be bought considering the news scenario.
Double no touch option: When a trader senses poor volume coupled with weak momentum during the price breakout above the resistance line then a double no touch option can be bought. Unless and otherwise there is a change in the volume and momentum scenario the price rise would not be appreciable. Additionally, the broken resistance will act as support. Thus, with weak momentum and subdued volume the possibility of a price reversal is also negligible thereby making the option expire in the money. Only unexpected news providing an upward or downward thrust to the price through an abrupt increase in volume can result in a loss.
Spotting a Descending Triangle Pattern
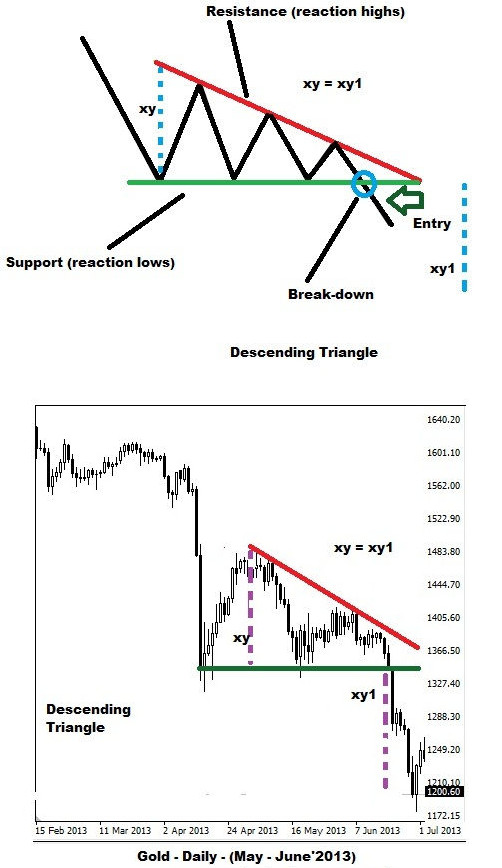
A descending triangle pattern indicates prevailing bearishness in trend and is usually seen after a decline in price. Similar to an ascending triangle, the volume declines when the triangle pattern develops and rises during the breakout. A horizontal line connecting two or more equal troughs (reaction lows) forms the support. The descending trend line (indicating bearish bias) is drawn by connecting at least two of the reaction highs. It should be remembered that a triangle pattern is considered to be descending only if the successive reaction highs are not equal. Thus a recent reaction high should not be equal or greater than the previous reaction high.

The continuation pattern is confirmed once the price, aided by a rise in volume, breaks below the support. The probable target price is calculated by subtracting the pattern’s widest distance from the
Setting up a Binary Options Trade with Descending Triangle
A descending triangle shares all the characteristics of an ascending triangle except the fact that the price breaks down below the horizontal support line made up of reaction lows. Thus, a binary options trader can purchase a 1min /30min /1hr put options, one touch put options, no touch options, double one touch options and double no touch options contract when the breakout happens. The purchase should be made after monitoring the volume and momentum scenario. The reward percentage, expiry period and scheduled news announcements should be given due consideration before selecting a suitable binary options contract to trade.
Locating a Symmetrical Triangle Pattern
A symmetrical pattern consists of two higher lows and two lower highs, which converge when connected through two extended trend lines. It is also referred to as a coil. Similar to other triangles, a decline in volume is seen when the pattern develops. The volume, however, rises considerably when the price breaks the support or resistance. The reaction highs should be reasonably placed. Additionally, the second high should be shorter than the first and the second low should be taller than the first. Thus, the upper and lower trend line should slope downwards and upwards respectively.


Another important point to note is that a symmetrical triangle pattern can even result in a trend reversal. Thus, a position should be taken only when the price breaks above or below the trend line. The break out happens when the price reaches ½ or ¾ of the way towards the completion of the pattern. The pattern is said to be complete only when the price closes above or below the trend line. Depending on whether the price breaks above or below the pattern, the apex will turn into a support or resistance. The widest distance in the pattern is measured and added to (price breaks above) or subtracted (price breaks below) from the break out price point to arrive at the target price.
Setting up a Binary Options Trade with Symmetrical Triangle
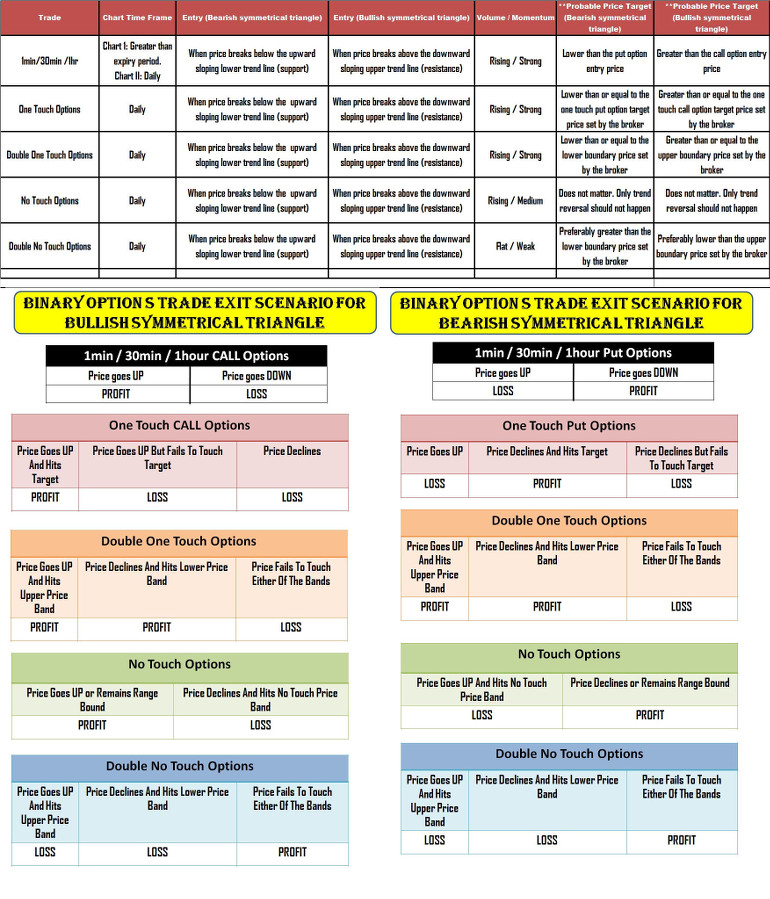
In the case of an ascending or descending triangle, a trader knows for the probable direction of price breakout. As far as a symmetrical triangle is concerned, being a continuation pattern, the price would usually break in the direction of prior trend. However, there are exceptions to this rule. Thus, a trader should decide the nature of the binary options contract only after the breakout happens.
If the price breaks above the downward sloping upper trend line (resistance) then the breakout can be traded in the same manner as an ascending triangle.
If the price breaks below the upward sloping lower trend line (support) then the breakdown can be traded in the same manner as a descending triangle.
Similar to an ascending or descending triangle, as insisted often, the volume and momentum scenario should be considered before entering a binary options trade. Depending on the direction of breakout, the ascending or descending triangle trade setup can be used as a reference.
A triangle (ascending/descending/symmetrical) pattern can be easily identified and traded as well. The two important criteria which a trader needs to remember are:
- A triangle is a continuation pattern
- Wait for the breakout before entering a trade.
As long as a binary options trader meticulously follows the basic rules of entry discussed above, trading a triangular pattern will be a rewarding and enjoyable experience.
You may also be interested in learning about other chart patterns that can be used to trade binary options:


