
Point and Figure Charts
The most common methods of representing the price action of a security on a chart are lines, bars and candlesticks. However, there is yet another form of price representation namely point and figure chart. The uniqueness of point and figure chart is that it does not plot the price movement against time but only against the changes in the trend. Thus, significant changes in price will only alter a point and figure chart.
Setting up P&F chart
A point and figure chart enables a trader to precisely identify the price points where the potential break outs (change in supply/demand relationship) may happen. This in turn allows a trader to easily map the probable future price trend of an asset.
Understanding a point & figure chart
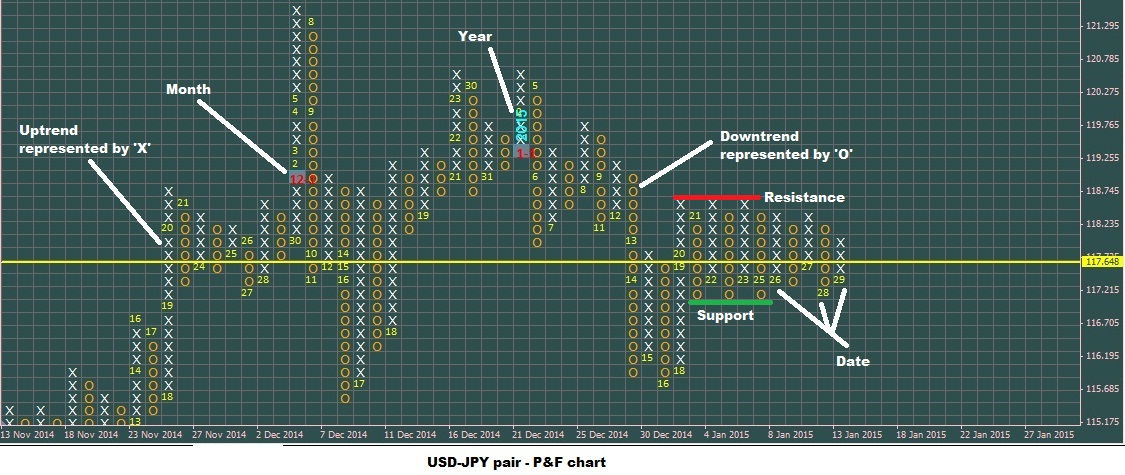
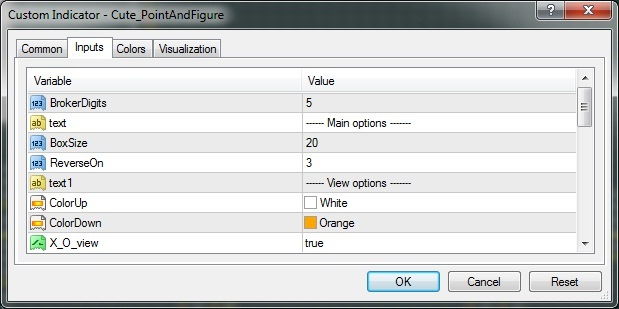
A point and figure chart is made up of columns of ‘X’s and ‘O’s, which symbolizes assorted price movements. A column of ‘X’ indicates a rising price while a column of ‘O’ represents a decline in the price of an asset. Each of these symbols (‘X’ and ‘O’) makes up a box, which indicates a predefined value of price movement. Additionally, price reversals, if any, begin in a new column. A typical Point & Figure chart is provided underneath (plotted using free Cute Point & Figure v1.1 indicator for MetaTrader 4):
The quantum of price movement necessary to begin a new column can be modified by the trader using the settings named ‘Reversal Amount’. Thus, ‘Reversal distance’ is the size of the box multiplied by the ‘Reversal amount’. This means that as long as the reversal distance is not breached, the prevailing column will continue.
Once the reversal or threshold distance is crossed then a new column begins and develops in a totally opposite direction to the previous one. By convention, ‘X’ is always plotted above ‘O’ and vice versa. You can use many P&F indicators to build similar charts.
Calendar markings
An important thing to keep in mind is that P&F charts do not show time in a linear fashion. Thus, depending on the price movement, each column can represent a single day or several days. So, each mark, irrespective of whether it is ‘X’ or ‘O’, indicates a significant price movement since minor changes (noise) is filtered. Additionally, each and every new calendar day, month and year are marked on the chart, as shown above, for easy study and analysis of price data.
Determining box size
One of the four different methods, described underneath, is used to select the box size. They are:
Classic scaling
Also referred to as normal scaling, the method involves the use of
| Price range of traded asset | Box size |
| Below 0.25 | 0.0625 |
| 0.25 — 1.00 | 0.125 |
| 1.00 — 5.00 | 0.25 |
| 5.00 — 20.00 | 0.50 |
| 20.00 – 100 | 1.00 |
| 100 – 200 | 2.00 |
| 200 – 500 | 4.00 |
| 500 — 1,000 | 5.00 |
| 1,000 — 25,000 | 50.00 |
| Above 25,000 | 500.00 |
Percentage (log) scaling
This method uses a fixed percentage of the stock price (based on the previous box below) to construct the box. For e.g., an input of 2 (i.e., 2%) for a $50 stock would create a box with a size of $1. This type of scaling is preferred when a stock undergoes substantial price changes.
User-defined scaling
The size of box, in this case, is determined by the trader as per the filtering needs. As the box size becomes larger the number of reversal signals will become lesser.
Average True Range (ATR) Scaling
In this method, the size of the box is decided based on the Average True Range of the asset. The default setting for ATR is 20 days. Being a dynamic method, there can be a noticeable change in the box size resulting in
Price options
The price used to calculate the box size can be one among the following:
- High or low price: When this option is enabled, either high or low price is selected. Sometimes, depending on the situation, both are ignored. The rule for the high or low price option is as follows.
- When the price is rising (uptrend). Use high when another ‘X’ can be drawn (ignore low). Use low when it triggers a 3-box reversal and another ‘X’ cannot be drawn (ignore high). Ignore both when the low does not trigger a 3-box reversal and the high does not call for another ‘X’.
- When the price is falling (downtrend). Use low when another ‘O’ can be drawn (ignore high). Use high when it triggers a 3-box reversal and another ‘O’ cannot be drawn (ignore low). Ignore both when the high is not sufficient to trigger a 3-box reversal and the low does not necessitate another ‘O’.
- Typical price: An average of the high, low and closing price is used to determine the box size.
- Closing price: Only the closing price is used to calculate the box size.
Constructing P&F charts
There are two well known ways of constructing a P&F chart. They are:
De Villiers’ method
As per this method, both the box size and the reversal setting are fixed at $1 and 1 respectively. Ultimately, this results in the creation of ‘X’s and ‘O’s in the same column and requires intraday data. Thus, the method, even though earliest, became unpopular soon.
3-box reversal method
This is the most popular method used by traders across the globe. The reversal setting used is ‘3’ in this case. Thus, a box size of $5 with a reversal setting of 3 will result in a reversal distance of $15 ($5×3). So, an upward trending asset will have only ‘X’ column until the price declines by more than $15 (reversal distance) from the peak. When the $15 reversal distance is breached, a new ‘O’ column would develop. Similarly, in the case of a decline, only a rise of $15 from the low would result in the formation of a new ‘X’ column.
In a case where the trader uses percentage scaling, a 1% box size with a reversal setting of 3 will result in a higher reversal distance during an uptrend and lower reversal distance in the case of a decline in the price of an asset (3% of 30 is higher than 3% of 28).
A 3-box reversal will cover anywhere between 9–24 months time on a chart. Thus, an increase in the box size will correspondingly increase the time covered on a chart. On the other hand, reducing the data period (for e.g., daily to intraday) and box size will result in increased sensitivity to the changes in price.
Trend analysis with P&F charts
Identifying trend is a major objective of any analysis and in this regard, a P&F chart offers invaluable assistance to a trader.
A P&F charts enables a trader to identify the trend with the same effectiveness as bar and candlestick charts. The trend analysis is done as described below:
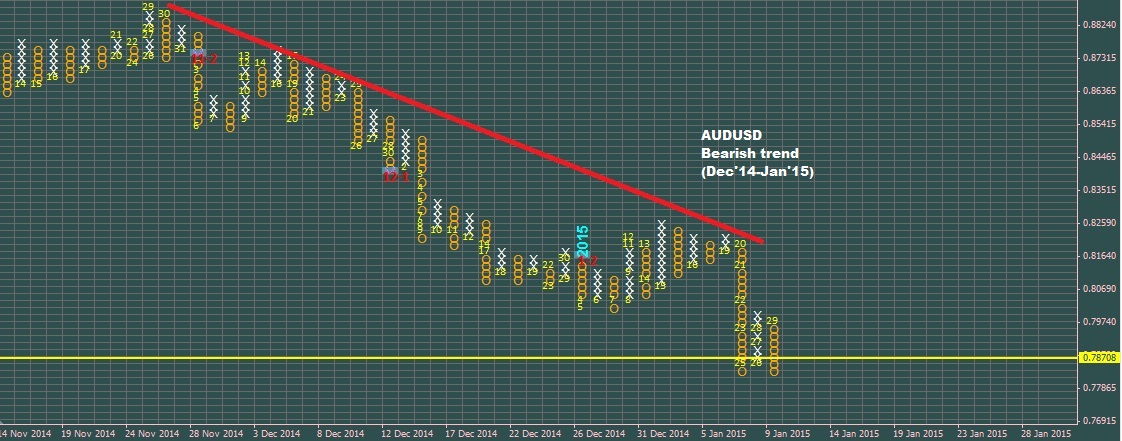
Bullish & Bearish trend line
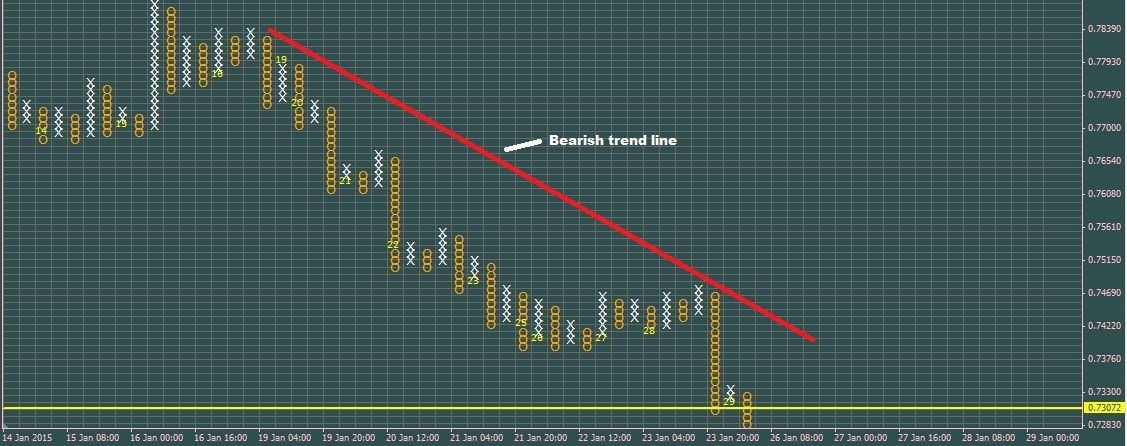
It should be remembered that a bullish trend line is always drawn at a 45° angle while a bearish trend line should be drawn with a 135° (45° turned upside down) slope. A lower rate of ascent (sideways price movement) usually leads to a break out.
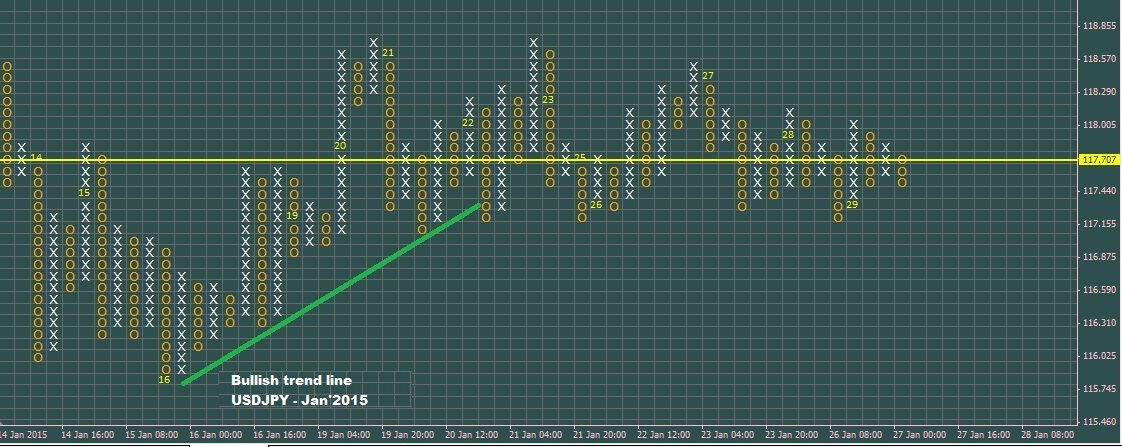
A long position should be taken when the price trades above the bullish trend line. All bearish signals should be discarded at that time. Similarly, a short position should be taken when the price trades below the bearish trend line. All bullish signals should be rejected in such instances.
A 3-box reversal below the bullish trend line indicates an end to the uptrend scenario. Likewise, a 3-box reversal above the bearish trend line signals an end of the downtrend scenario. In such circumstances, a trader should close the long or short position and monitor the price action for the next trading opportunity.
Another point to remember is that a break out or break down is confirmed only when a trend line is broken clearly. There are situations where the price extends till the trend line thereby indicating a change in the rate of ascent. This does not mean a break out. The image below shows an example where the trend line is touched often but without a successful reversal.
Contrary to the belief of beginner traders, a Point & Figure chart can be used to trade binary options as well. A P&F chart does not give importance to time. On the other hand, success in binary options depends on the timing of entry in particular. However, the contrast between the two can be nullified through proper settings. To trade binary options efficiently using P&F charts, the settings should be fine tuned for short expiry periods. To put it simpler, the box size and the reversal amount should be preferably 1pip and 1 respectively for trading 1min options. Such a setup allows more data to be displayed for analysis and identification of support and resistance level precisely. For 30min options, the box size and reversal amount should be a little bit higher. There are no hard rules for the settings. However, a trader should keep in mind that the final setting should allow precise (down to the final pip) identification of support and resistance level.
With a small box size and reversal setting, a trader will be able to analyze even the smallest price movement (necessary for trading 1minute options). On the other hand, such a setup does not allow proper assessment of the prevailing primary trend.
To enable a proper view of the trend, the scale box (right click on screen->properties) should be adjusted such that the lower and upper boundaries of the scale (
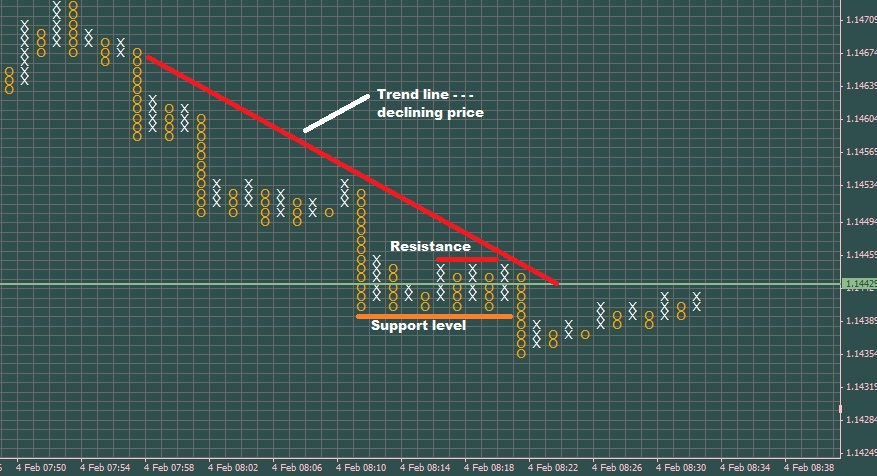
Chart patterns
A P&F chart facilitates spotting different kind of chart patterns (similar to candlestick patterns) as illustrated below:
Bullish chart patterns
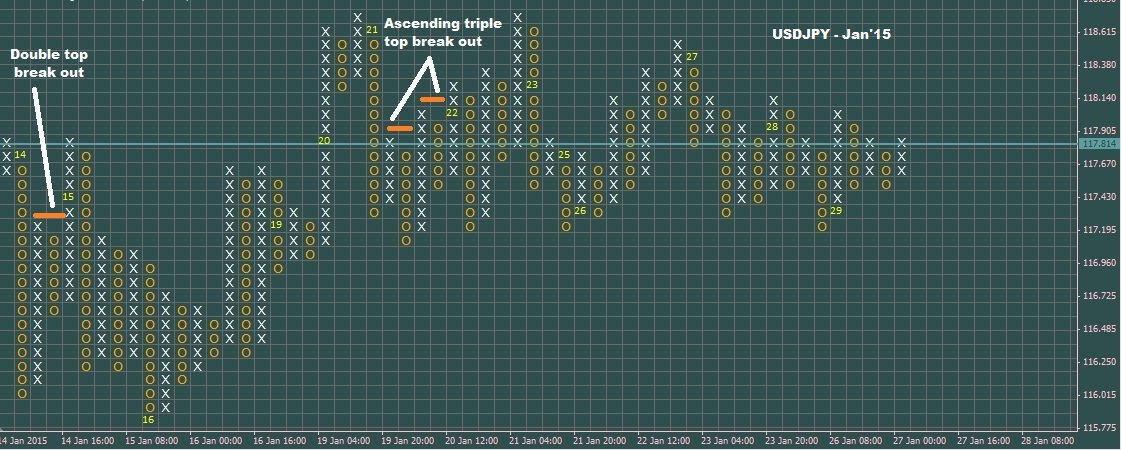
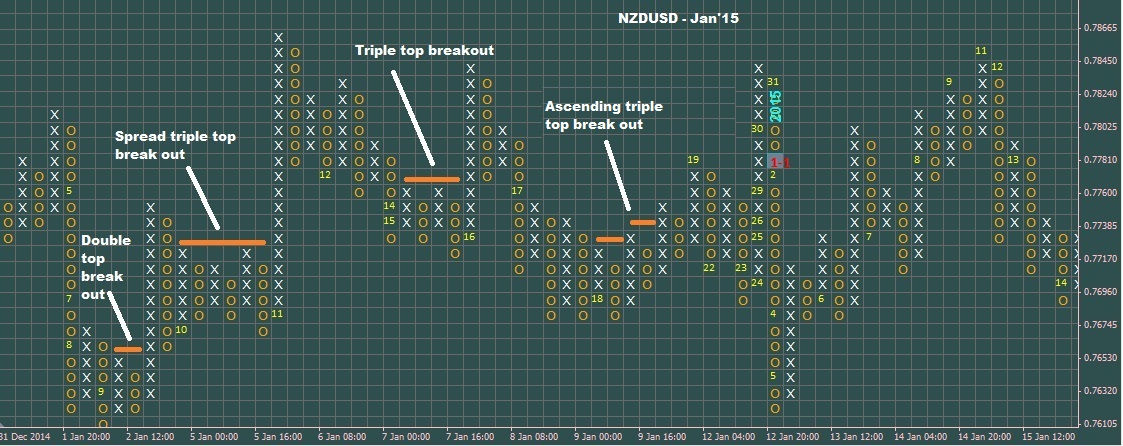
- Double top
break-out . This pattern consists of two ‘X’ Columns separated by a ‘O’ column. The second ‘X’ column forms the higher high while the first ‘X’ column indicates the trend. The ‘O’ column in between forms the confirmation of support. It is a common pattern and obviously has higher chances of failure.
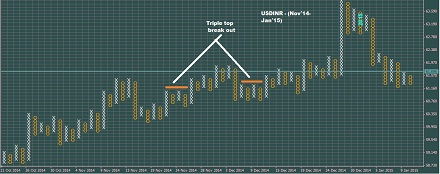
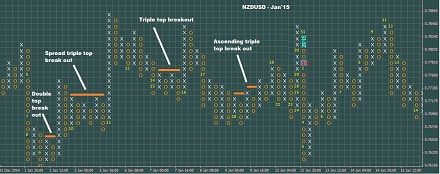
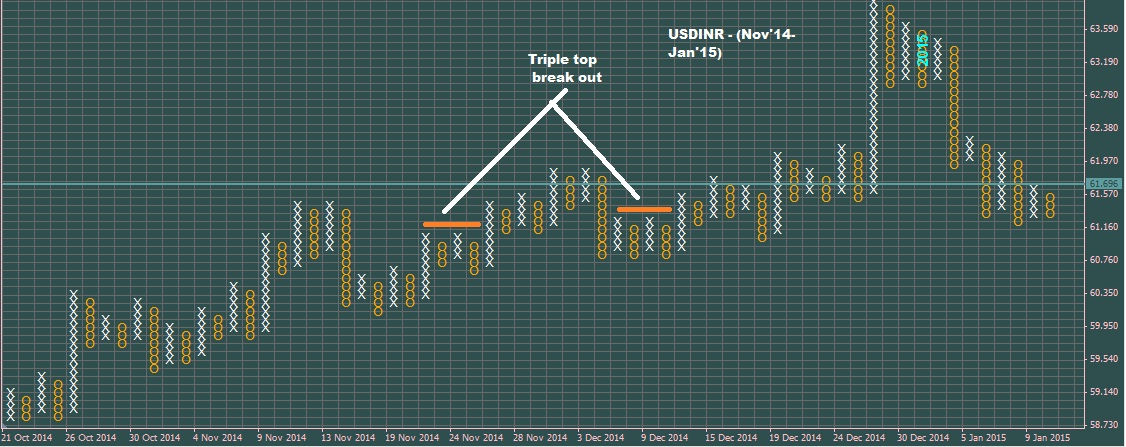
- Triple top
break-out . A triple topbreak-out pattern includes threeX-columns and twoO-columns . There will be two successiveX-columns (withO-column in between) in the pattern with equal reaction highs. These consecutiveX-columns indicate a resistance to the price movement. The finalX-column will break above the previousX-columns to complete the triple topbreak-out pattern as shown below.
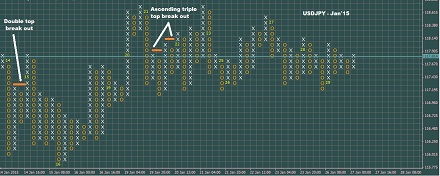
- Ascending and Spread triple top break out. A
back-to-back double topbreak-out is referred to as Ascending triple topbreak-out . Likewise, a Spread triple topbreak-out is an expanded version (with another column of ‘X’s and ‘O’s in between) of the normal triple top break out pattern. The patterns are shown in the chart below:
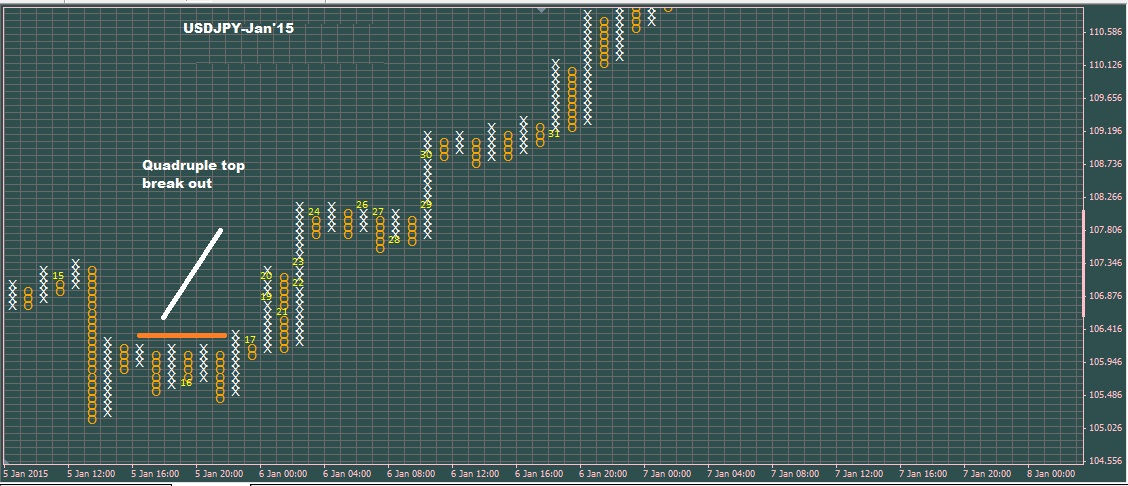
- Quadruple top
break-out . Another ‘X’ and ‘O’ column added to a triple topbreak-out pattern results in the formation of a Quadruple topbreak-out pattern as shown above.
All the patterns mentioned above are useful to trade binary options with expiry ranging from 1minute to 1day. A trader should adjust the box size and scale size as discussed earlier to clearly identify the trend, support and resistance level.
If the trend is upward, a trader should only look for bullish chart patterns (triple, quadruple, spread or multiple top
Only such a move will keep the trader’s position safe. This is because, in the case of binary options, even a one pip move in favor of the trader will fetch the reward. If the trader suspects a triple top break out pattern then taking a call option during the end of the final ‘O’ column is the most preferred one. It will keep a trader’s position safe irrespective of whether the expiry is 1min or 1hour. Only a trend reversal can put the trader at loss. Even if the pattern extends into a spread triple top break out or quadruple top break out, still the trader has a very high probability of success because of the entry near the support level.
Moreover, the developing pattern (a triple top, quadruple top or multiple top
Bearish chart patterns
The prominent bearish chart patterns are:
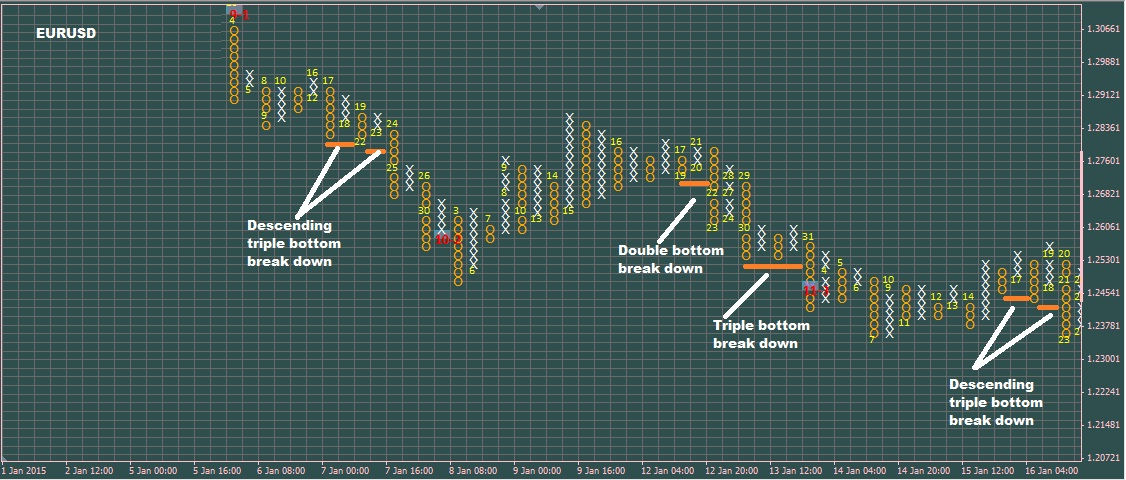
- Double bottom breakdown
- Triple bottom breakdown
- Spread triple bottom breakdown
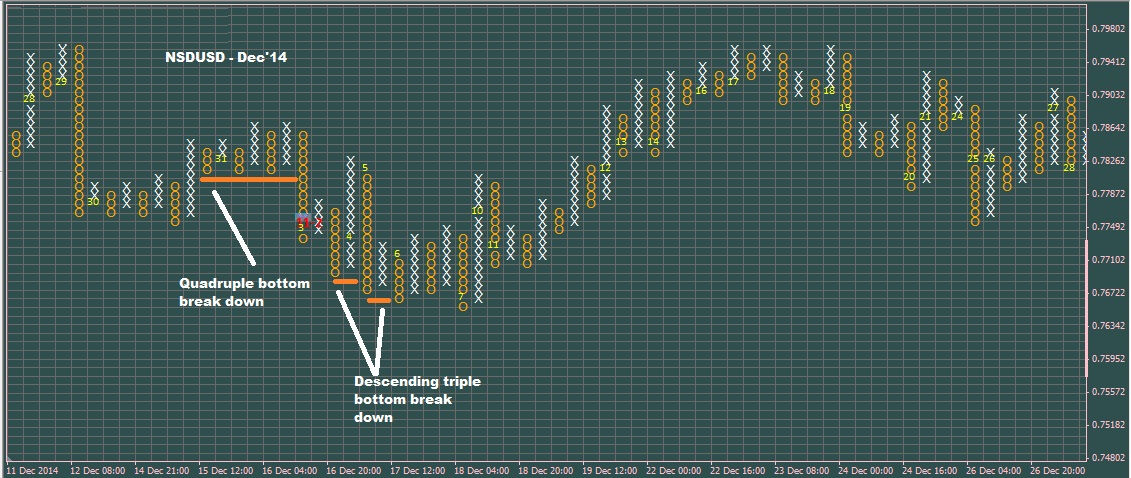
- Descending triple bottom break down and
- Quadruple triple bottom break down.
If the column of ‘X’s and ‘O’s are interchanged (in a bullish chart pattern) and the
Again, all the bearish patterns can be used to successfully trade binary options (1minute to 1day expiry) as long as the settings are fine tuned to give a clear indication of the existing trend with support and resistance levels.
When the primary trend is downward then a trader should look for bearish patterns. The put option purchase should be made near or at the resistance level in the developing pattern (triple, quadruple, spread or multiple bottom
Reversed bullish & bearish signals
A reverse bullish signal begins to develop with a series of ‘X’ and ‘O’ columns forming ‘higher highs’ and ‘lower lows’ respectively. The final ‘O’ column in this rising price pattern extends below the low of the previous ‘O’ column thereby indicating a reversal in the trend.

A binary options trader can purchase a one touch put option to benefit from the bullish reverse signal. Once the
If the momentum is not strong enough to create a deep decline in price then the trader will lose the one touch put option trade.
Alternatively, a binary option trader can purchase a no touch option with price above the resistance (highest high in the ‘X’ column just before the
Since the chances of reversal are negligible, a binary options trader stands to gain anywhere between 200% and 500% from proper application of one touch and no touch binary options.
Any spikes above the resistance zone would render the no touch options useless. This may happen during periods of high volatility.
There are situations where a
If the news halts the prevailing
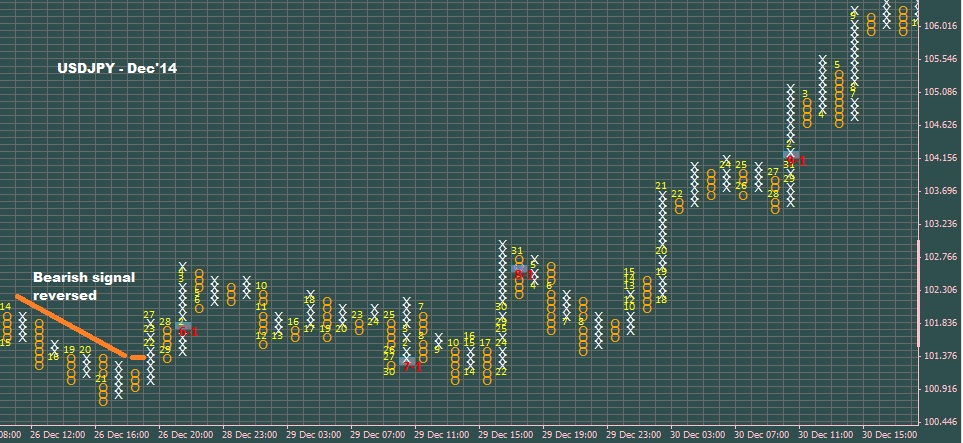
In the case of a bearish reverse signal, the final ‘X’ column breaks above the high of the previous ‘X’ column thereby indicating the beginning of an uptrend. The chart below indicates the formation of a reversed bearish signal pattern.
A binary options trader can purchase a one touch call option once the price
Alternatively, a no touch option with price below (recent lowest low in the ‘O’ column) the support can be bought as well. Again, in this case, a single spike below the support will make the options end out of money.
As long as the pattern is recognized correctly and the entry is done at the right time, the trader stands to gain between 200% and 500% from both one touch and no touch option trade.
A double one touch option trade can be entered if the trader is not sure about the trend. A double one touch option trade with price below the support and above the
Bullish & bearish catapults
A
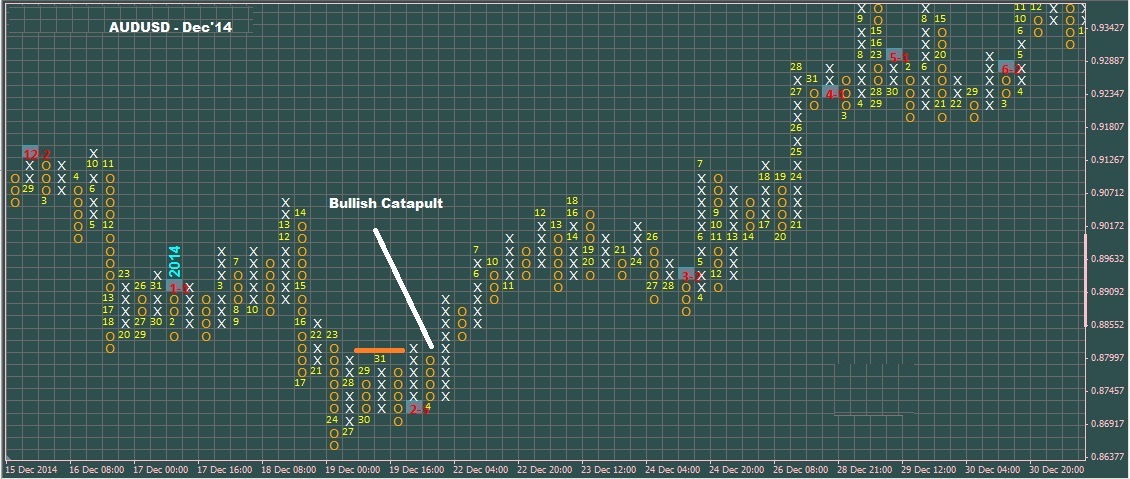
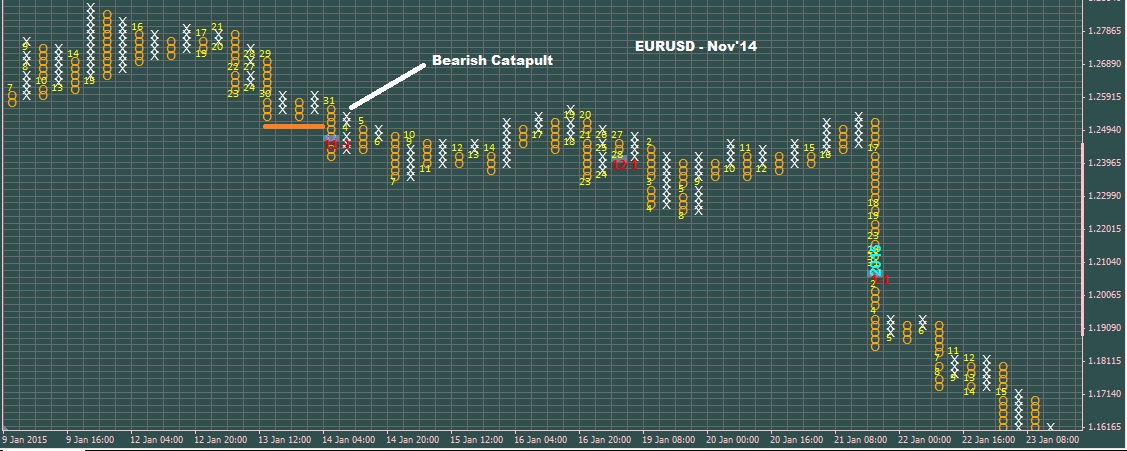
The ‘O’ column extends back into the Spread (or multiple) triple top
Bullish and bearish triangles
A triangle pattern develops when ‘X’ and ‘O’ columns together form a series of lower highs and higher lows respectively. The
If the triangle formation results in a

A better alternative is to purchase a no touch option with price below the lowest low in the triangle pattern. The trader will benefit as long as there are no spikes or trend reversals. The yield will be in the range of 200% to 500% depending on the risk and volatility of the underlying asset. Even if the price reverses and touches the lower band once, the option will result in out of money expiry.
If the trader is interested in taking a position before the
If the triangle formation results in a
A no touch option is always a better alternative for a triangle
A trader who is willing to enter a binary options trade before the
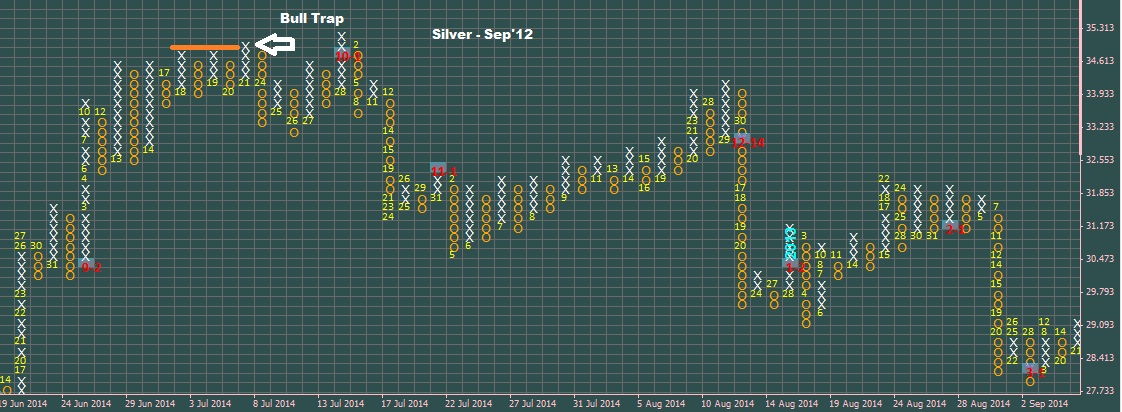
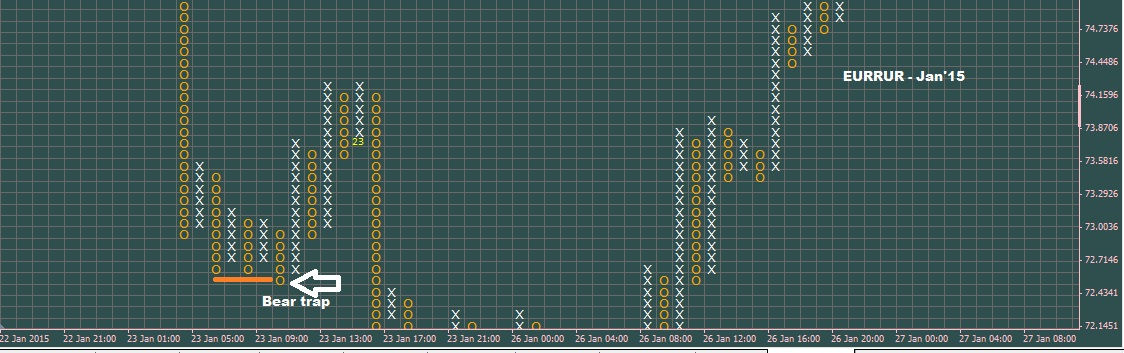
Traps (bull & bear)
When the price reverses after a one box break out, the resultant formation is a bull trap. Similarly a one box break down followed by an uptrend in the price gives rise to a bear trap. As the name suggests, a bull and bear trap is usually seen before the beginning of a down trend and up trend in price respectively. The scenario ensures that bulls and bears are trapped off guard.
Forecasting target price
There are two ways of calculating the price target in a P&F chart. They are:
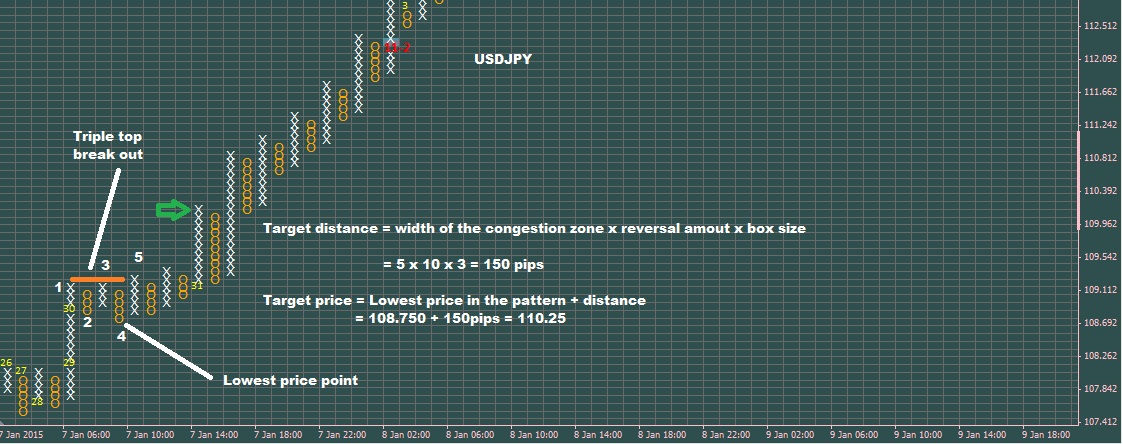
- Horizontal count method. To calculate the probable target price, the foremost thing to be done by a trader is to identify the congestion zone (pattern which forms the break out). The width of the congestion zone is then multiplied by the box size and reversal amount. Finally, the value is added (long position) to the lowest price in the pattern (triple top break out etc.,) or subtracted (short position) from the highest price in the pattern (triple bottom break down etc.,) to get the probable price target. The image below clearly explains how a price target is calculated in a P&F chart using the horizontal method.
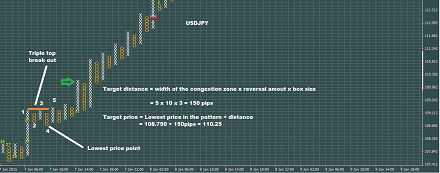
- Vertical count method. In this case, the width of the pattern has no relevance. However, the height of the pattern determines the price target. To calculate the price target for a long position, a trader should count the number of ‘X’s (in the pattern) next to the column with the lowest (immediately near to the pattern) price point. It is then multiplied with the box size and the reversal amount to determine the probable price distance. The value is then added to the lowest price point to arrive at the target price.
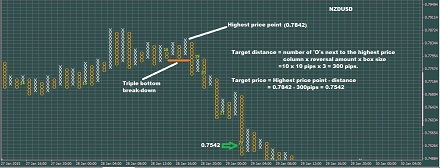

To calculate the price target for a short position, the number of ‘O’s to the right of the highest price point in the pattern is counted and then multiplied with the box size and reversal amount. The final value is then subtracted from the highest price point to arrive at the probable price target.
Advantages of P&F chart
- Removes unwanted noise because of 3-box rule.
- Allows a trader to focus on major price movements
- Removes time constituent from analysis.
- Enables easy identification of support/resistance levels.
- Trend forecast can be done easily as the signal from the chart is either a buy or sell and
well-defined . - Stop loss and take profit levels can be calculated for every breakout.
Trading with P&F charts will be easier as long as the trader has sufficient knowledge to determine a suitable reversal amount. In the initial stages, a trader can try different reversal amount settings and determine the most suited one using the historic chart signals. Additionally, a trader should develop the ability of spotting crucial price patterns. Once a trader develops the discussed traits, successful trading decisions can be made with confidence. You can use this analytical technique with any binary options broker.