
Average True Range Indicator
In search for more useful indicators of price movement and strength in the market, J. Welles Wilder, creator of popular ones such as the Relative Strength Index (RSI), the Average Directional Index, and the Parabolic Stop and Reverse, has developed yet another indicator that is used in the core of technical analysis. This engineer introduced in 1978 the average true range indicator as a measure of volatility. Seeing the importance of the concept in increasing profitability from the correct timing of a trade, Wilder proposed a tool that can cue traders on when to enter or exit trades based on the price movement of products. In this way, traders can use the mediating factors of the indicator to know the right values that will yield a profitable trade. Wilder allowed technical traders to detect limited gaps, moves, and
In his
What is True Range?
Before we define the TRUE range, we must know that the range of trading in a day is simply the lowest price of the day subtracted from the highest price of the day.
![]()
The true range however, considers the closing of yesterday’s trading day. Therefore, the true range is whatever is the greatest among the following:
- the difference between the latest high and the latest low (today’s high and low),
- the absolute value of the difference between the latest high and the previous close (yesterday’s close),
- and the absolute value of the difference between the latest low and the previous close.
The summary of the requirements above is denoted by the following:
![]()
In the computation for true range, absolute values are used to ensure positive numbers, because we are interested in measuring the distance between two points, not the direction.
It is also worth noting that the true range includes yesterday’s closing price if it is outside of the price range for today (between high and low). The inclusion simply means that the true range covers any overnight gap that may have taken place from the previous day to the next.
What is Average True Range?
The Average True Range is the measure of the mean daily ranges for a number of days, usually between 7 to 14 days, to determine a stock’s (or a forex rate’s) volatility. The arithmetic mean formula is used to calculate a first ATR value:
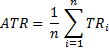
where n is the number of data points and TRi is the true range value for index i.
Then, the succeeding ATR values at time t can be calculated with the following:
![]()
ATR in Charting and MetaTrader
The range or true range of a bar is the high minus the low. If the high of a bar is 1.4783 and the low was 1.4698, then the range of the bar is 1.4783 minus 1.4698, which is 85 pips.
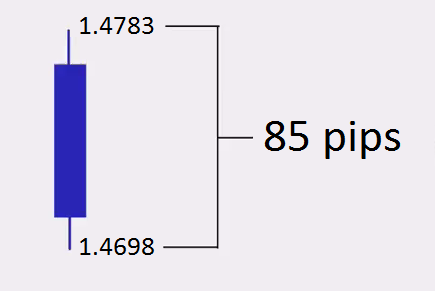
ATR comes into play when more than one bar is considered. For example, let us take 10 as our period. To calculate the ATR, we take the average of the ranges of 10 bars, starting with candle number 1, and then taking the range of candle number 2, and so on. The average of those ranges is the ATR. This is particularly useful because it gives trader an idea how many pips a bar is likely to move. Those who want to improve their entry points should consider using a limit or stop order.
Adding ATR to MetaTrader
To add ATR to MetaTrader 4 or 5, simply click on the Insert menu, and then click on Indicators->Custom->ATR.

Similarly, you can also open ATR through the Navigator on the left panel.
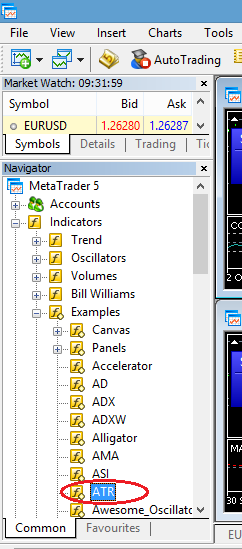
Once clicked, the dialog to add the ATR comes up.
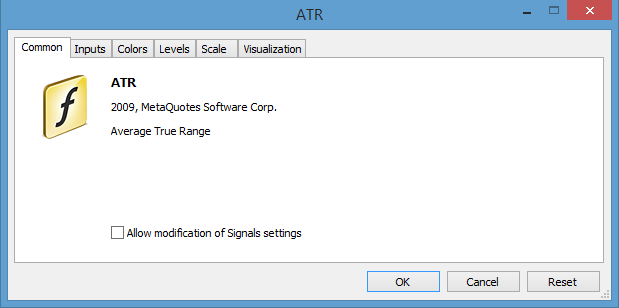
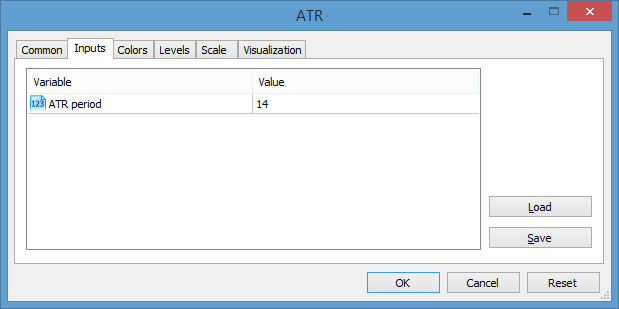
The Inputs Tab lets you enter parameters for your indicator. Normally, we can set the ATR period to 14 days.
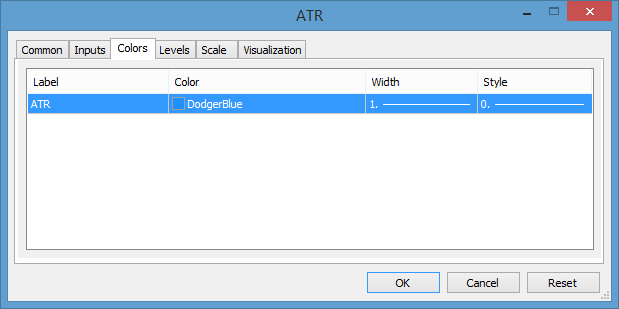
The Colors tab lets you customize the indicator for visibility in the charts
Price levels can also be added to the indicator for visibility.

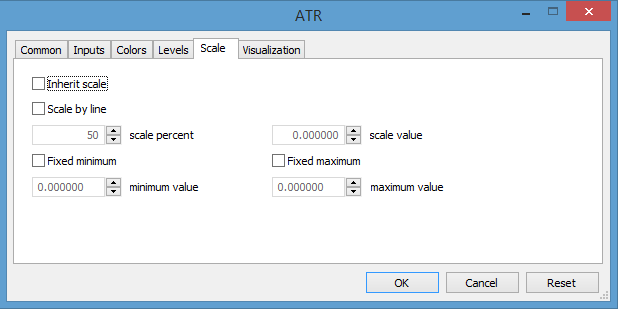
The trader can also set the fixed minimum and fixed maximum values of the indicator as well as its scale percentage.
Once all the settings are filled in, adding the indicator will be seen in the charts. The following example is an ATR(14) of GBP/USD.
![]()
To analyze the ATR indicator, let’s consider a snapshot of the same ATR as above.
The green bars above indicate the price and the blue line below indicates the ATR. As we notice, the first pair shows a mild drop (a slight change) in the price, thus the small incline of the indicator. The second shows a drastic drop in price and a corresponding jump in volatility as shown by the ATR. The last pair shows stability as shown by the drop of the ATR.
Using ATR as a strategy for Binary Options
ATR was initially used for the commodities market where volatility is more prevalent. Forex and binary options, however, are also using this indicator. Traders rarely use a measure to anticipate future price movement directions, but instead use indicators to gain a perception on the recent historical volatility and to prepare an execution plan for trading. A reliable trading strategy is important in building a successful trading portfolio. Many people fail to realize that all aspects of the financial market are constantly changing; a 50 pip difference today may be increase or decrease in a few days. Adopting sound binary options strategies improves the experience levels of traders in finding a
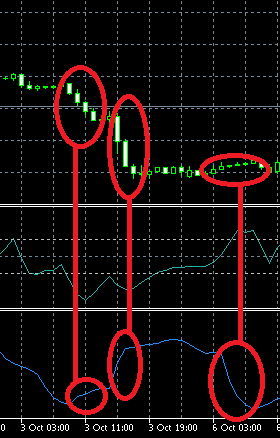
One use of ATR in binary options is to know when to trade. As seen the following diagram, still showing a snapshot of GBP/USD with ATR(14), we see four pairs of encircled areas.
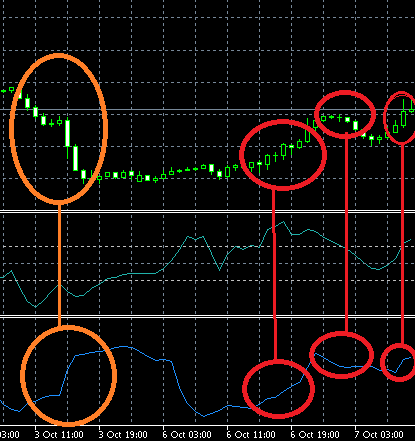
The first orange pair does not correlate vertically to each other, meaning that the rise of the price is not the same with the movement of the ATR. The three red pairs, however, show the price movement to have a direct relationship with the indicator. How each pair correlates in terms of direction to one another is the focal point of the trading signal. When a correlating movement between our assets trend and the ATR line is seen, this is considered as a signal to place a trade in the direction of the trend. If we see an upward movement with our assets trend and the ATR line, then we place a CALL option, and a PUT option if otherwise. Therefore, the first and the third red pairs should indicate a CALL opportunity, whereas the second red pair should influence the trader to purchase a PUT option. By simply minding the expiry times for these signals, all things considered, they won’t often exceed the historical trend that is indicated in the chart.