
Average Directional Movement Index
Determining the strength of a price will help any binary options broker decide on the right option to purchase. This is especially important for Call/Put options, but also very much applicable with Touch/No Touch pairs. If a price is strong, short term bullish strategies can definitely result in immediate profit. If a price is showing signs of weakness, then bearish binary options strategies may apply. Similarly, binary options traders can also take advantage of this situation.
What we are going to discuss today is a strength indicator, much as the Relative Strength Index, the Money Flow Index, and the True Strength Index, all of which are discussed in articles found in this site. This indicator is called the Directional Movement Index or DMI, which was developed by J. Welles Wilder who also developed the RSI. When the average values of the directional movements is considered, then the DMI becomes ADX or the Average Directional Movement Index.
The Directional Movement Index is an indicator for identifying when a definable trend is present in an instrument. That is, the DMI tells whether an instrument is trending or not. This is shown by the strength and volume of a price. If there are many trades that leads to strong buying actions, then we say that the DMI is high or the price is strong. On the contrary, selling actions may mean that there is a decline in the price and that the price is going weak.
Because one of the major features of the DMI is its ability to determine whether a trend is strong or weak, it can consequently be deployed to evaluate the strength of the prevailing trend. The Directional Movement Index can be used to trade any financial asset such as commodities, futures, stocks and currencies. This technical indicator is also popular among binary options traders for functioning well with most trading periods.
The Directional Movement Index is particularly helpful in various trend trading strategies because it differentiates between strong and weak trends. This allows the binary options trader trader to enter only the strongest trends. When this happens, risk is reduced and greater chances for success in trades ensue. Like other indicators, DMI has a range from 0 to 100, while getting the moving average of the DMI results to the ADX or the Average Directional Movement Index.
Characteristics of the Directional Movement Indicators
The Directional Movement Index can be a moving average of range expansion over a given period, which is usually 14. There are two
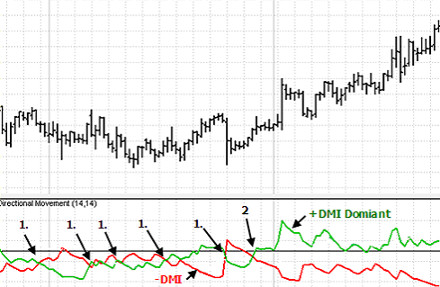
The following figure shows a stock chart with the +DMI and -DMI indicators graphed out below. Each
However, there could be false crossovers. False crossovers are present when the +DMI and -DMI are cross, but the trend does not ensue. From the figure, we can see that there are several false crossovers, marked as 1’s. Meanwhile, as time moves on and the trades continue, a crossover at Point 2 leads to an uptrend with +DMI dominant. This is denoted as a true crossover and traders can find it safe to enter trades based on this indicator.
DMI Calculations
When the +DMI and the -DMI are combined, the ADX smooths the resulting curve with an exponential moving average. To calculate +DMI and −DMI, a binary options trader needs the price data consisting of high, low, and closing prices each period, typically every trading day. To obtain the ADX, the binary options trader first calculates the directional movements +DMI and the -DMI. Here is are the formulae contained the the ADX algorithm
- UpMove = today’s high − yesterday’s high
- DownMove = yesterday’s low − today’s low
- If UpMove > DownMove and UpMove > 0,
then +index = UpMove, else +index= 0 - If DownMove > UpMove and DownMove > 0,
then −index = DownMove, else −index = 0
After selecting the number of periods, which defaults to 14 days, +DMI and −DMI are:
- +DMI = 100 x EMA(+index) / average true range
- −DMI = 100 x EMA(-index) / average true range
The exponential moving average is calculated over the number of periods selected, and the average true range is an exponential average of the true ranges. ADX is therefore calculated as:
- ADX = 100 x EMA (+DMI − −DMI) / (+DI + −DI)
There are variations of this calculation that typically involves using different types of moving averages, such as a weighted moving average or an adaptive moving average.
Interpretations of the Index
ADX is a lagging indicator which means that a trend must have established itself before the ADX will generate a signal that a trend is under way. This means that binary options traders will have to make use of models to accurately predict the reliability of the indicator. ADX will also range between 0 and 100. In general, ADX readings that are below 20 indicate trend weakness, and readings that are above 40 indicate trend strength.
By knowing whether the a trend is strong or weak, a binary options trader can wisely choose whether to stick to a trade or not. A weak trend may indicate that the price is erratic, and it is risky for the trader to enter the trade. A strong trend means that the price is steadily moving upwards or downwards, something that binary options traders know to be a good indicator of successful trades.
For more indicators that could be helpful in your trades, watch out for more articles from us.