Candlestick Patterns for Binary Trading
We learned that candlestick charting is a useful and popular way to perform technical analysis for binary options. Using candlestick charting, patterns are clearer and easier to identify. Many who have used this type of charting technique demonstrated highly accurate returns. It is used by many binary options investment to make sure that their investment proves successful during a trade.
Now that we know the construction of candlesticks, let us take a look at some of the pertinent patterns of candlesticks that may be useful for analysis of binary options. Candlestick patterns consist of around forty reversal and continuation patterns. All of which have dependable probabilities of indicating an accurate future direction of price movement. We saw how candlesticks show price movement including highs and lows. This should give a binary options trader an idea on whether to make a call or put on his next trade.
In this article, we discuss the eleven major candlestick patterns that provide enough trade situations and information for traders to forecast. These eleven major patterns should be mastered by heart but this does not mean that the remaining secondary patterns should not be considered. In fact those signals are extremely effective for producing profits. They may occur very rarely, but for the new trader, mastering these eleven is crucial for that first profit.
One of the advantages of candlestick binary options trading analysis is that it does not require memorizing long formulas or ratios. It is a visual representation of the trends and does not require
To review, when you can see an asset price closing higher than where it opened, this will produce a green candle. An asset price closing lower than where it opened creates a red candle. The boxes that form are called the Real Body, and extremes of the daily price movement are represented by the lines extending from the body called Shadows. Let’s take a look at some other candlestick patterns.
Doji
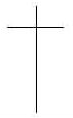
A Doji is formed when the open and the close values are the same or are very close. The length of the shadows are non pertinent because they still close at the same price. The Japanese interpretation of the Doji is that the bulls and the bears are conflicting. The appearance of a Doji should alert the trader of major decision.

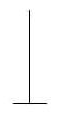
Gravestone Doji
The Gravestone Doji is formed when the open and the close occur at the low of the day. This pattern is occasionally found at market bottoms. It’s name, Gravestone, is taken by the way it looks like a gravestone.
Long-Legged Doji
The
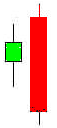
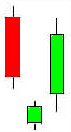
Bullish Engulfing Pattern
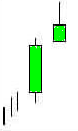
The Bullish Engulfing Pattern is formed at the end of a downtrend. As seen, a green body is formed that opens lower and closes higher than the red candle open and close from the previous day. This complete engulfing of the previous day’s body represents an overwhelming buying pressure and a dissipating selling pressure.
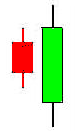
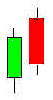
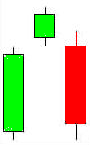
Bearish Engulfing Pattern
The Bearish Engulfing Pattern is the direct opposite of the bullish pattern. This pattern is created at the end of an
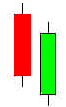
Dark Cloud Cover
The Dark Cloud Cover is a
Piercing Pattern
The Piercing Pattern indicates a bottom reversal. It is a
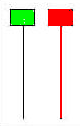
Hammer and Hanging-Man
The Hammer and
Morning Star
The Morning Star projects a bottom reversal signal. Like the planet Mercury (Morning Star), it foretells the sunrise, or the rising prices. This pattern consists of a three day signal.
Evening Star
The Evening Star is the exact opposite of the morning star. Like Venus (Evening Star), this occurs just before the darkness sets in. The evening star is found at the end of the uptrend and is also a 3-day pattern.
Shooting Star
A Shooting Star sends a warning that the top is near. This pattern got its name by looking like a shooting star. This formation, found at the bottom of a trend, is a bullish signal. It is also known as an inverted hammer and is important for bullish verifications.
Shooting Star