Trading Binary Options with Multiple Timeframes
There are two important requisites to successful trading. The first one is the identification of the trend and the second one is the precise entry. To achieve those objectives, successful professionals always suggest beginners to compare the charts of higher and lower timeframe with that of the trading timeframe. The advice is based on the simple fact that a higher timeframe chart always reflects, with clarity, the primary trend of a security. Similarly, minute nuances (accurate high or low) of price movement can be seen clearly only in the lower timeframe chart. Thus, entering a trade in line with the primary trend and near the recent high or low price increases the probability of success. Let us see how the same strategy can be applied in binary options trading.
Basics of Multiple Timeframe Trading
The process of multiple timeframe trading begins with the trend analysis in the higher timeframe chart. If the trend in the higher timeframe chart matches with the prevailing trend in the trading timeframe chart then a trade can be taken using the
Practically, to analyze trend, professionals suggest beginner traders to choose a timeframe, which is at least three times more than the trading timeframe. Likewise, a timeframe, which is at least three times lower than the trading timeframe is the ideal one for spotting entries.
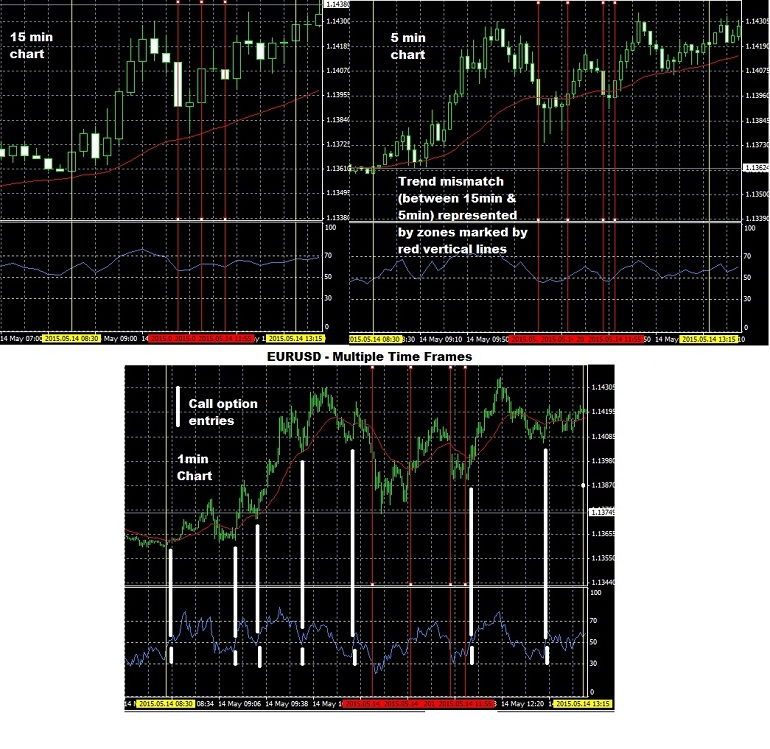
For example, let us consider that the trading timeframe is 5min. The higher and lower timeframe would be 15min and 1min respectively. If the 15min and 5min chart indicates an uptrend then a long position is taken during the final stages of retracement (decline) in the 1min timeframe. Similarly, if the 15min and 5min chart indicates a downtrend then a short position is taken during the final stages of a pullback (uptrend) in the 1min timeframe.
The strategy discussed above enables a trader to be in line with the major trend and enter near the lowest/highest price. Only a trend reversal in the higher timeframe can put the trader at loss.
To identify the trend, an exponential moving average can be used. For spotting entries a trader can use a fast moving oscillator such as a RSI (relative strength index) or stochastic.
Setting Up a Binary Options Trade
5 min / 30 min / 1hr options
To begin with, a trader should remember that as per the multiple timeframe strategy, the option contract’s expiry time period should be used as the trading timeframe. Thus, for a binary options contract with 30min expiry period, the trading timeframe would be the 30min. The lower and higher timeframe, based on a minimum of 3x multiple, would be 5min and 4H respectively.
Let a 14-period exponential moving average be added to the price chart. In the
Now the entries are made as follows:
- Check whether the price is above or below the 14-day moving average in the higher timeframe. If the price is above the 14-day moving average then it means that the trend is up and vice versa.
- Match the higher timeframe chart’s trend with the existing trend in the trading timeframe chart.
- If the trend in the higher timeframe matches with the trend in the trading timeframe then we have an opportunity to enter.
- Wait for the RSI to cross above or below the 50 level in the lower timeframe. Bullishness is indicated when the RSI crosses above the 50-level. On the other hand, bearishness is indicated when the RSI crosses below the 50-level.
- If the trend is up (as indicated by a match between trends existing in the higher and trading timeframe) then buy a call option soon after the RSI crosses above the 50-level in the lower timeframe. If the trend is down then buy a put option soon after the RSI crosses below the 50-level in the lower timeframe.
 Please note that a call or put option is bought only when there is a cross- over of RSI signal across the 50-level and not when the RSI moves above/below the 50-level.
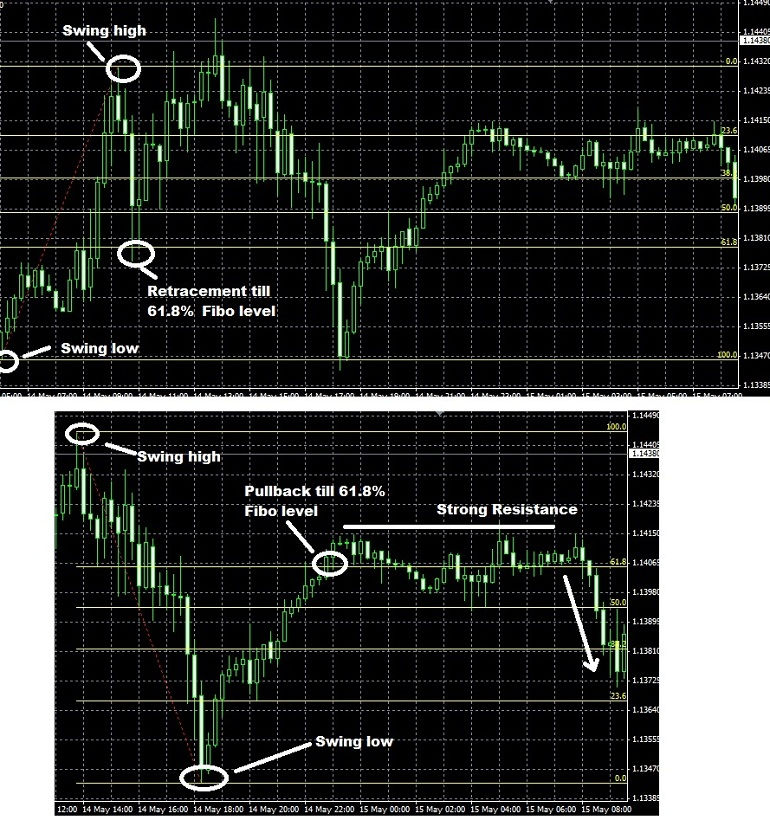
To succeed in binary options trade not only is the entry important. The price should also stay above or below a level prescribed by the binary broker at the time of expiry. To identify the probable price limit an asset can travel during a given period of time, let us draw a Fibonacci retracement line using the recent swing low to high (uptrend) or swing high to low (downtrend) in the trading timeframe chart. As the diagram below illustrates, 61.8% (commonly referred as the golden ratio) level is where the price normally touches during a retracement from an uptrend or a pullback from a downtrend.
So, even if there is a perfect trade setup, it is better to avoid an entry if the target price of the broker is away from the 61.8% retracement level.
One Touch Options Trade
A one touch call or put options trade is done as discussed above. The most important thing is that the target price provided in the broker’s platform should be equal or preferably less than the 61.8% level. This will ensure success provided all other steps are taken correctly.
A double one touch options trade can be traded in the same manner. However, it should be noted that only the target price which lies in the direction of the trend has the higher probability of being touched. Thus, with a multiple timeframe strategy, it is better to trade a one touch options contract, which usually offers better returns.
No Touch Options Trade
A no touch options trade is executed in a slightly different manner. The strategy discussed above ensures that price hits a particular level. In the case of no touch options trade, we would wish to see the price deviate away from the ‘no touch’ price level set by the broker. This is achieved in the following manner:
- To begin with, check whether the ‘no touch’ target price is in the direction of the primary trend or not. If the target price is not in the direction of the trend then we have an opportunity to trade as per the step by step procedure provided earlier.
- Purchase the contract when the RSI makes a
cross-over (above or below the 50-level) in the direction of the trend in the lower timeframe chart.
For example, let us consider that a no touch options contract is available for trade with 30min expiry.
- Check the primary trend indicated by the higher timeframe (4H). If it is up then monitor for an uptrend in the 30min (trading timeframe) chart.
- Choose a no touch options contract with target price below the moving average.
- Purchase the no touch option contract once the RSI crosses above the 50-level in the lower timeframe (5min) chart.
It is better to avoid trading a double no touch options contract with this strategy since one of the ‘no touch’ target price will be in the direction of the primary trend.
Once a trader gets hold of the strategy, trades can be executed successfully several times a day, as illustrated in the images, since the primary trend lasts for a longer period of time.


