
Oscillators in Binary Trading
When viewing charts that are
The true value of the oscillator is seen when the stock is either overbought or oversold. Using oscillators a binary options trader can see when the stock is losing momentum on the uptrend, the level at which the stock moves into an overbought situation. This simply means that the buying volume has been diminishing for quite sometime. This also means that traders will then start to sell their shares. Conversely, when a stock has been sold by a greater number of investors for a consistent period of time ranging from one to six months or longer, the stock will enter an oversold situation.
Stochastic Oscillator
The stochastic oscillator was introduced by George C. Lane in the late 1950s. The term stochastic means “guess” or “random” in Greek while to oscillate is to move back and forth. Stochastic oscillators consist of a scale from 1 to 100 and two stochastic lines, where one line is the “fast” stochastic, and the other is the “slow” stochastic. Signals are generated when the “fast” stochastic line crosses with a “slow” stochastic line. The indicator also produces signals when the stochastic line moves into the overbought region of the scale (i.e. 80 or above) or the oversold region (i.e. 20 or lower).
Stochastic Lines
A full stochastic consists of two lines, %K and %D. %K tracks the current market spot trade for a currency pair while %D smoothes out the %K line by calculating and plotting the exchange rate as a moving average. The following is the formula used to calculate stochastic lines
- %K = 100 x (Closing Price — Lowest Closing Price for N Periods) / Lowest Closing Price for N Periods
- %D = 3-Period Moving Average of %K
%K is the stochastic fast and %D is the stochastic low. This is because %D is a moving average based on the past 3 %K valuations, making it slower to react to changes in the spot rate.
It is always helpful for an indicator to be bounded in a constant range, such as the stochastic oscillator is between 0 and 100. For one thing, binary options traders do not need to worry about
One major problem of the fast stochastic is the lack of smoothing. Jagged %K lines are common. They reach extreme readings quite frequently, jumping about and making it hard to interpret. An easy solution can actually be applied. Traders use a smoother line of the fast stochastic as the %K line instead, and then average it, using the new average as the %D line. The new line is the average of the average of the old line. This is how the slow stochastic is constructed.
Using the Stochastic Oscillator in MT4
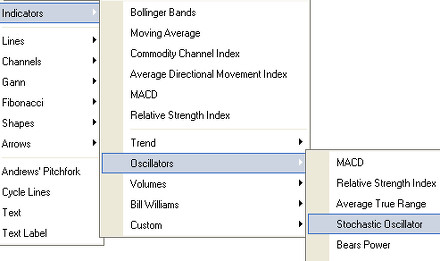
The stochastic oscillator indicator can be added on the charts in MetaTrader 4. The binary options trader just needs to perform the following steps. First, open MT4, go to Insert-> Indicators-> Oscillators-> Stochastic Oscillator as shown below.
Next, the Stochastic Oscillator Settings Menu appears. Here, the trader can modify the different parameters of the indicator. The window should look something like the figure below.
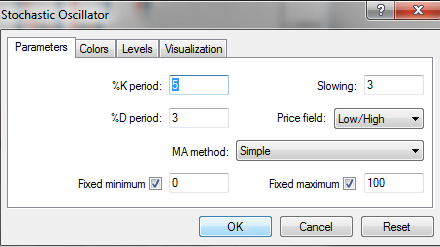
There are two types of parameters: calculations, and visuals. Calculations are parameters that include the amount of periods used for the stochastic oscillator and other parameters. Visuals include how the indicator will look (color, thickness of lines, etc.)
Here is a summary of the parameters:
- %K period: defines how many previous periods are used to calculate the main signal.
- %D period: defines the amount of periods used to smooth the %K values.
- Slowing: defines the number of recent calculations to average together for additional smoothing of %K.
- Price field: defines if the lowest lows and highest highs are used for calculation or lowest closing and highest closing prices.
- MA method: defines the moving average method for calculating the %D signal.
- Fixed minimum/maximum: Defines the visual borders of the indicator. (stochastic values always range between 0 and 100)
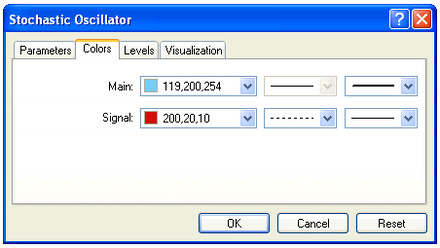
- Colors: defines colors for the Main (%K) and Signal curve (%D). They are shown in another tab as shown below:
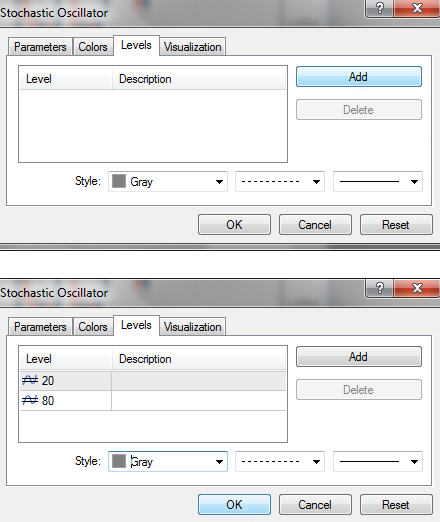
- Levels: The usual way of trading the stochastic oscillator is by looking for overbought or oversold conditions. These are shown by a value of over 80 (overbought) or under 20 (oversold). The levels will define the lines on the chart.
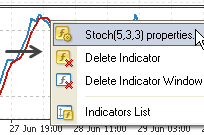
To change the indicators parameters at anytime, or to delete them, the trader can right click on the indicator to show the contextual menu shown below:
Start using this kind of indicator to integrate them to your trade. We have a list of the top binary options brokers that will help you get started with trading binary options using their great features and bonuses.