
Fibonacci Retracements in Binary Options
In binary options trading, Fibonacci retracements is a method used by traders to perform technical analysis specifically to determine support and resistance levels. It is based on the idea that markets will retrace a predictable portion of a move, after which they will continue to move in the original direction. This means that asset prices typically exhibit signs of random movement and that one cannot consistently outperform market averages.
Leonardo Fibonacci, an Italian mathematician in the 12th century, discovered the “Fibonacci numbers,” which are a sequence of numbers where each successive number is the sum of the two previous numbers (e.g. 1, 1, 2, 3, 5, 8, 13, 21, 34, 55, 89, 144, etc.) He also discovered that these numbers are interrelated, such as the fact that any given number is approximately 1.618 times the preceding number. This relationship has been used in many applications, including trading, where ratios play an important factor in determining retracement levels.
Fibonacci Ratios
Fibonacci retracement is created by taking two extreme points on a chart and dividing the vertical distance by the key Fibonacci ratios. 0.0% is considered to be the start of the retracement, while 100.0% is a complete reversal to the original part of the move. Once these levels are identified, horizontal lines are drawn and used to identify possible support and resistance levels. These lines are called Fibonacci Retracement Lines, or Fib lines for short.
The interpretation of the Fibonacci numbers in technical analysis anticipates changes in trends as prices tend to be near Fib lines. Because of this, we need to find out how these Fib lines are determined. We already know two, which are the 0% and 100% levels, or the lowest or highest point, or vice versa.
The key Fibonacci ratio where most retracements occur is at the 61.8% level. Dividing the numbers higher up in the sequence approaches the Fibonacci Retracement of 61.8%. For example, 55/89 x 100 = 61.797%, 89/144 x 100 = 61.805%, and 144/233 x 100 = 61.803%. Other ratios are formed when dividing any number in the sequence by the number that is found two or three places to the right. For example, the 38.2% ratio is obtained by dividing 34/89 x 100%, and dividing 55/233 x 100% gives 23.6%.
Fibonacci retracements are tools provided on charts, and not an indicator per se. Every good charting platform should be able to have it. Fib lines are used primarily for trending markets, regardless of direction. They can be used for both up and downtrends. Fib lines also connect highs to lows or vice versa in any given trend. They automatically draw the retracement levels. Depending on how the trend is moving along with the current pullback, retracement levels may or may not be aligned correctly. The trader needs to adjust connection points accordingly to help line up the current candlesticks with the retracement levels. Once the trend is done, the Fib lines become obsolete. They need to be redrawn for the new trend that develops.
How to draw Fibonacci Lines in MetaTrader 4
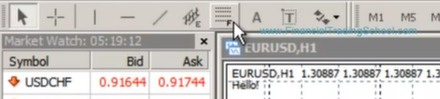
Using MT4, a trader can include Fib lines into a stock chart. After MT4 has launched and an asset chart is loaded, look for the draw tool in the toolbar that could be labeled as Fibonacci Retracement as pictured below.
After clicking on the button, choose a high point in the chart and click and drag down to a low to show the guidelines. In the figure, the drag started at the high point in the
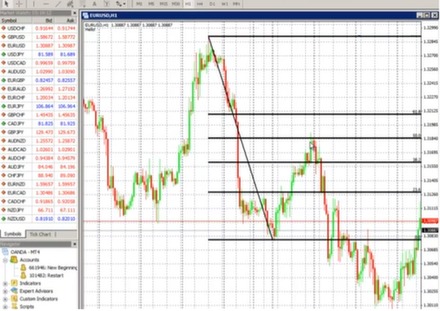
The high point represents the 100% of the sequence, and the low represents 0%. As seen in the figure, continuing from the 0% low point, the trend retraces back to 50% then starts to decline again. The guidelines help show where the price passes through the sequence while it goes up or down.
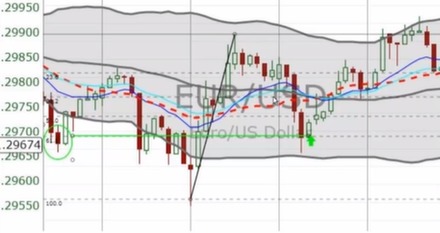
After finishing analysis on a trend, it is always wise to redo the Fib lines to avoid confusion. Here is an example of an uptrend after our previous example.
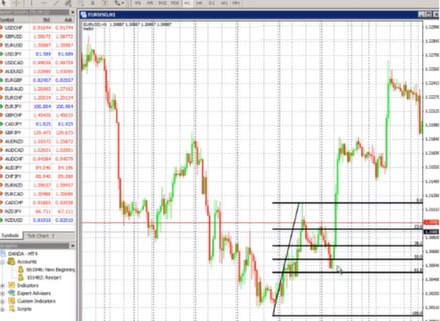
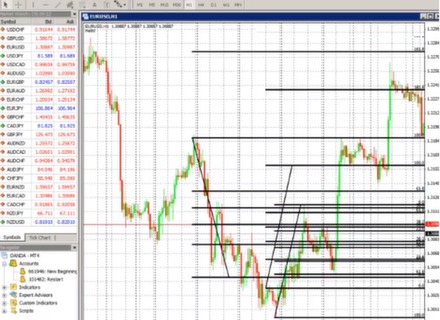
Notice how the 61.8% (at the mouse cursor) indicates a bounce in the price trend. Finally, here is an example of multiple Fib lines integrated into one chart. Notice how it can easily create confusion on the part of the trader.
Reading Fibonacci Retracements
Typically, Fib lines are drawn on higher time frames only, since lower time frames don’t pay attention to them. When setting up charts, new traders may want to see if there are any Fib levels coming up. Experienced traders can probably just spot it by eye. If the trader can get into the habit of repeatedly drawing Fib lines over and over, they can start noticing when they work.
Again, it is wise to delete old Fib lines after the trend is over, and start new ones for new trends. As mentioned earlier, 61.8% is the key level to be watching for Fibonacci Retracements. If 23.6% does not hold, then it may move to 38.2%, then 50%, then finally 61.8%. Sometimes, the price may even overshoot these levels.
Here we have an example of the use of Fib lines to determine when the price will move back up. The diagonal line represents the uptrend, the downtrend succeeding the line is called the
Through constant practice, binary options traders can apply Fib lines to their charts to see where a retracement can occur. They can then purchase the appropriate option based on the Fib line analysis performed. Using Fib lines, binary options trader can make informed decisions about a price level moving up or down, instead of just making shots in the dark.
We have more strategies, tools, tips, and techniques for you as you get the hang of trading binary options wisely. You can also check out our list of top binary options brokers to claim your rewards and bonuses today.