
Doji Candlesticks
In this article, we will be talking more on Doji candlesticks, hereon referred to as just Doji, an invariant noun which means it can also denote a plural. We have touched on Doji in our introduction to candlesticks. It is quite important to revisit that tutorial to know what we are to talk about here. We also has a number of helpful pieces that will get you well on your way in trading binary options. Let us go on with Doji then.
Doji are important market indicators that are in the form of candlesticks. On their own, they are able to provide information that is important for the binary options trader. As a component in a consolidated graph, they can indicate important patterns. Doji can be seen when an asset’s price opens and closes at virtually the same price. Because of this, it is usually just their shadows that can be seen.
Doji have longer upper and lower wicks relative to their real bodies which is usually small. They can have
Kinds of Stand-Alone Doji
As we mentioned earlier, Doji can be interpreted as a
Long-legged Doji
A long
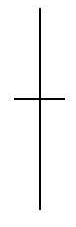
A
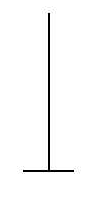
Dragonfly Doji
Dragonfly Doji are candlesticks that formed at the height of the trading session. During the time period, the trade had a considerable drop, then it eventually found the support it needs to rally itself back to close at the same price level as when it open. Dragonfly Doji are often seen after a moderate decline, and are bottom reversal indicators when confirmed with a bullish engulfing.
A Dragonfly Doji
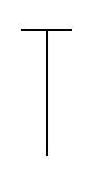
Gravestone Doji
Gravestone Doji are the opposite of the Dragonfly Doji. This candlestick indicates a low opening price of an asset relative to the trade. During the trade period, it has reached a very high level but encountered a resistance that caused it to plummet back down to its opening price level where the price finally closes. A Gravestone Doji looks like a gravestone, and its name and function can easily be related as an impending doom for a stock. They are good reversal indicators when confirmed with bearish engulfings.
A Gravestone Doji
There are different scenarios where one can encounter Doji. The most general indicator that traders look into are Doji that are found at the top or a bottom of a trend which usually indicate direction change or reversal. During consolidation periods, Doji usually make up the sideways channel, and so, precede any big movement to form a new trend.
The doji being a key trend reversal indicator, is such when there is a high trading volume following an extended move in either direction. When a market has been in an uptrend and trades to a higher high than the previous three trading days, fails to hold that high, and closes in the lower 10% of that day’s trading range, there is a high probability of a downtrend in the ensuing days. Likewise, when the market has been in a downtrend and trades to a new low that’s lower than the three previous trading days, fails to hold that low, and closes in the upper 10% of that day’s trading range, there is a high probability of an uptrend in the ensuing days.
You can already read more about doji combinations. Additoinally, our list of recommended binary trading brokers can surely help you get started with trading binary options.