
Doji Candlestick Combinations
By now we are already knowledgeable in reading candlesticks on their own. We know their parts, their meaning, and the indication of what a binary options trader would do for different kinds of candlesticks seen on historical trend lines. However, looking into candlesticks individually does not help a lot. Binary options analysis requires what to make of a series of candlesticks, to know which trend, either bullish, bearish, or neutral is imminent.
Binary options trading is analyzing historical data to create an accurate forecast of what the price levels will be. For the binary options trader, this is important to make informed decisions that more often lead to successful trades. Knowing what combinations of candlesticks mean is important for the binary options trader. It lets the trader forecast trends and other indicators that lead to correct predictions. Let us look into the different combinations of candlesticks and how to interpret them as part of the technical analysis performed in trading binary options.
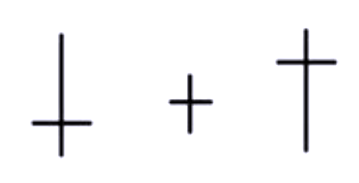
We recall doji candlesticks to represent market tops and bottoms. The assets that these candlesticks represent open and close at prices that are virtually equal. There is no or negligible candlestick body for this type of trade. The length of the upper and lower shadows can vary. Doji candlesticks should denote an indecision when the trade was formed up to the time that it closed. That is why we often see them at tops and bottoms of trends.
Reading Trend from Doji
The interpretation of a doji depends on the immediate preceding trend or candlesticks. Doji indicate that the forces of supply and demand are becoming more evenly matched and a change in trend may be near. But, doji alone are not enough to mark a reversal and further confirmation may be warranted. It is therefore wise to look at the candlestick before the doji to make an accurate prediction as to where the price will move.
Generally, the binary options trader must look into the following sequences to make out the correct trent. After a positive or a long green candlestick, a doji indicates that the buying pressure is starting to decline. After a negative or long red candlestick, a doji indicates that the selling pressure is starting to decline. Because doji generally indicates a trend reversal and are found in crests and troughs of trendlines, looking at the candlestick directly preceding a doji can tell much about a trend and how a binary options trader should react.
Long Positive Candlestick Before a Doji
A doji found after an positive or long green candlestick indicates that buying pressure may be in the decline and the uptrend could be nearing its end. Whereas an asset can drop simply from a lack of buyers, continued buying pressure is required to sustain an uptrend. Therefore, a doji may be more significant after an uptrend or long green candlestick. Even after the doji forms, a further downtrend is required to confirm a bearish trend. This may come as a gap down, a long red candle, or a decline below the long green candlestick’s open. After a long green candlestick and doji, traders should be on the alert for a potential evening doji star. As we have learned an evening star, or a star at the beginning of the night, indicates a decline.
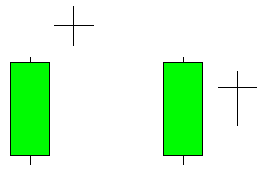
Let’s think of it this way. Since the long green candle indicates a strong uptrend in the price, a doji right after the strong uptrend could mean that there is an indecision going on between buyers and sellers. This mean that the strong uptrend seems to be dying down and a downtrend could be imminent. The binary options trader could then take advantage of this information by purchasing a put option in the appropriate period of time.
Long Negative Candlestick Before a Doji
After a decline, or a long red candlestick, a doji may indicate that selling pressure is starting to diminish and the downtrend could be nearing an end. Even though the sellers are starting to lose control of the decline, further strength or support is required to confirm any bullish reversal. This confirmation could come from a gap up, a long green candlestick, or an advance above the long red candlestick’s open. After a long red candlestick and doji, traders should be on the alert for a potential morning doji star. A morning star can be thought of as the start of a new day, or an uptrend.
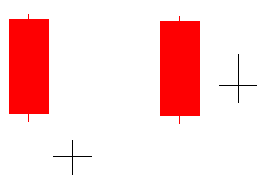
Conversely, since a long red candle indicates a strong downtrend in the price, a doji right after this strong downtrend could also mean that there is an indecision going on between buyers and sellers. This could mean that the strong downtrend seems to be strengthening and an uptrend could be imminent. The binary options trader could also take advantage of this information by purchasing a call option in the appropriate expiry time.
Other Bullish and Bearish Candlestick Indicators
Outlined below are some bullish and bearish candlestick indicators that a binary options trader must master so that looking and interpreting a trendline where these candlesticks are present become second nature.
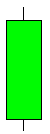
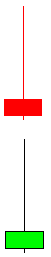
A long green candlestick indicates that the bulls or buyers controlled the trading for most of the trading period.

A long red candlestick indicates that the bears or sellers controlled the trading for most of the trading period.

Small candlesticks indicate that neither the buyers nor the sellers could move the trend significantly. The prices finished about where they started.
![]()
A long lower shadow candlestick indicates that the bears or sellers controlled the trading for part of the trade, but lost control at the end of the trading period where the bulls or buyers made an impressive comeback.
Conversely, a long upper shadow candlestick indicates that the bulls or buyers controlled the trading for part of the trade, but lost control at the end of the trading period where the bears or sellers made an impressive comeback.
![]()
Lastly, candlesticks with long upper and lower shadows indicate that the both the buyers and the sellers had their moments during the trade, but neither could put the other away which resulted in a standoff.
Why not try looking at a stock chart now to apply what you have learned today? We have more tutorial items in store for you. Meanwhile, you can look at our list of recommended binary brokers so that you can start trading binary options like a pro.