20-Minute Trading Strategy
A key component to being a successful binary options trader is to keep learning and improving. One way to do this is by studying different strategies that other traders use. This article will cover, in detail, a 20-minute binary option strategy. It can be used to trade binary options that are based off of any major stock futures indices, such as the NASDAQ-100 or S&P 500, and have an expiration time of 20 minutes. This particular strategy focuses largely on technical indicators such as the Parabolic SAR, Bollinger Bands, MACD, and the volume of instrument being traded. Each of these components will be discussed in depth at how to use them and what setups to look for before placing a trade. However, before we get into the specifics of this strategy, let’s first look at what exchanges offer this particular type of
The 20-Minute Binary Option
As the name suggests, this is a type of option where the outcome of the trade is determined within a 20-minute time frame. A trader’s job is to decide whether the option contract will expire above or below the underlying assets strike price. These are relatively new and not every binary options broker offers this type of security. Currently, the safest and most reputable exchange to offer this is called the North American Derivatives Exchange or Nadex. This exchange is regulated in the United States and is one of the most popular among binary option traders because of that. The examples and charts that are shown in this article will come from the Nadex platform. Binary.com is another platform that offers 20-minute options and provides flexibility of early close.
Getting Started
In order to use this strategy, a trader should understand what the various technical indicators being used actually are. This section will briefly cover the four main indicators used in this strategy.
- Parabolic SAR — This indicator largely focuses on the relationship between price and time. It is often used to find potential reversals in the market price and spot new trends when they are initially forming. This signal is represented by “dots” on a trading chart. A dot placed below the price is considered to be bullish. Conversely, a dot above the price is used to illustrate a bearish sentiment.
- Bollinger Bands – This is used to help measure and visualize the volatility in the market. Typically, these bands are plotted on a chart to show two standard deviations away from the simply moving average of the underlining asset. How far apart these bands are from each other in relation to the price will give a trader a clearer picture of market conditions.
- MACD — This stands for moving average convergence divergence. It is used to show the relationship between two different moving averages. Generally, the MACD is calculated when the 26-day exponential moving average (EMA) is subtracted from the 12-day EMA. This number is then plotted on top of a 9-day EMA of the MACD known as the signal line. A bearish signal is given when the MACD falls below the signal line and the opposite is true for a bullish signal.
- Volume — This is simply the number of underlying asset’s units that are traded over a given period of time. The higher the volume, the more volatile the security tends to be. This is extremely useful to look at because it will confirm trends and chart patterns.
If this is your first time learning about these indicators do not worry. Next, this article will cover how to exactly use these in the 20-minute trading strategy.
The Strategy
To start, this trading approach is considered a bearish strategy. We are looking for market conditions that signal
Step 1
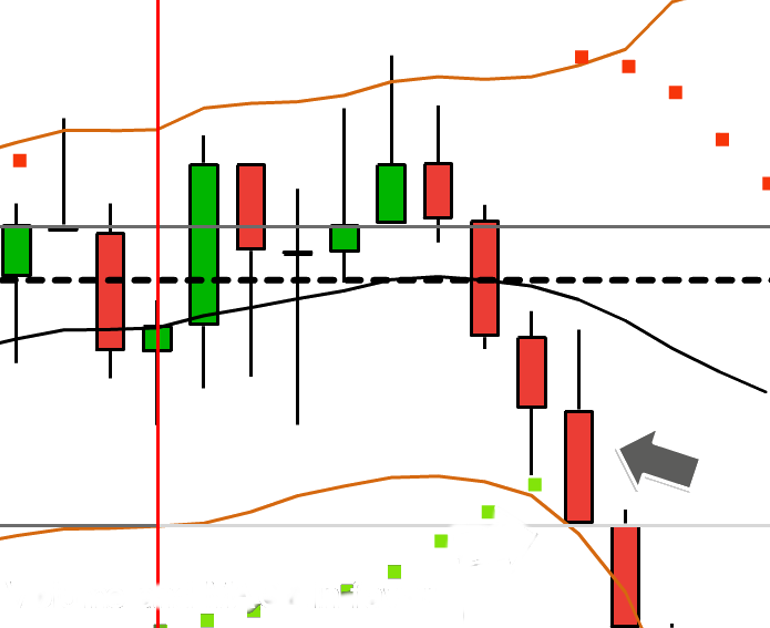
Look for a major stock futures index whose intraday price is declining in value. Once we have done this, our first major signal of a potential profitable trade will come from the Parabolic SAR indicator. Look at your trading chart set to 5 minutes with this indicator applied to it. If there is a red bearish candlestick with a dot above AND directly next to it then you have fulfilled the criteria for this step. This is the first (5-minute) candlestick to look for in this strategy. The image below shows an exact example. It is our earliest sign that the trend is potentially shifting out of its current range and moving to the downside.
Step 2
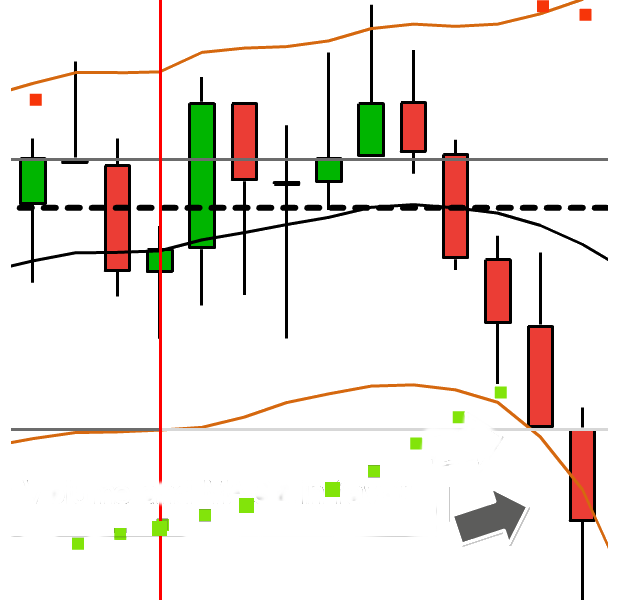
This is where the Bollinger Bands come into play. After the conditions from step 1 are fulfilled, you want to make sure the next candle on the chart is sticking close to the bottom Bollinger Band. This means that the price is deviating from its average and is our second signal that the asset is declining in value. It is extremely important to watch the price action at this point. It is common for the price to rebound during this time and continue in its previous range. However, if there is a real change in the trend, the second candlestick after step one will follow the Bollinger Band downwards. Take a look at this below:
Step 3
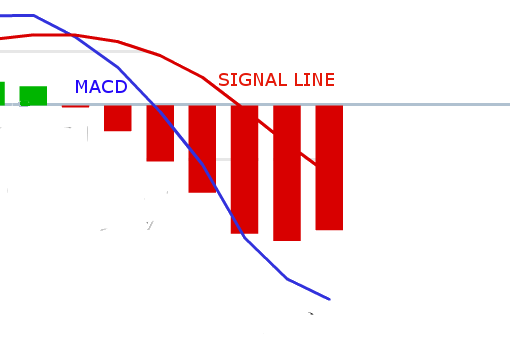
Here we need to look at the MACD indicator. We want to make sure that the MACD is crossing over and falling below the signal line. This is our third sign that the market has a bearish sentiment and is likely to experience downward momentum. This should be paid attention to simultaneously when performing steps 1 and 2. Here is an example of what you want the chart to look like.
Step 4
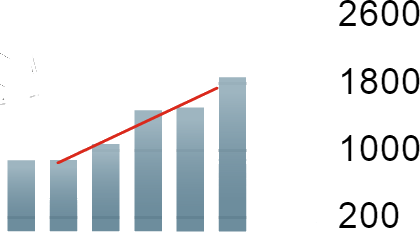
This is the last step we need to consider before executing a trade. Take a look at the volume and make sure it is increasing. This signals to us that traders are going with this trend and ensures us that there is a downward shift in price occurring. The volume should look something like the graph below.
Trade Execution
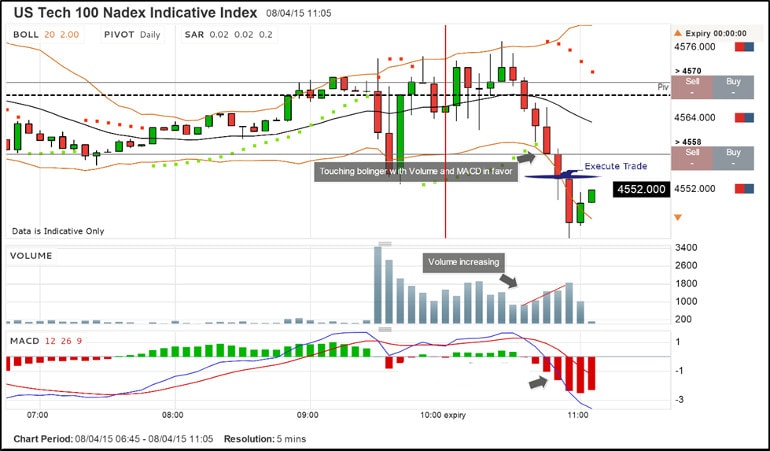
Once the conditions for all four steps has been met, then it is time to execute a trade. Choose a put (sell) option that will expire within the next 20 minutes or less. The options strike price should also be at the money. This means that the options strike price is the same price as the underlying security. This will give the largest potential profit by only needing the option to move down in price slightly. Once entry is made into the trade, pay close attention. We only want to stay in the trade for maximum 10 minutes or until this short term option expires. This is where experience with trading this strategy will become helpful. Watch your trading chart carefully. Any signs of bullishness or price reversal should be a trigger to exit the trade and take quick profits. The chart below shows a complete example of a profitable trade using this strategy. All of the technical indicators are applied to the chart and you can see a better overall picture of this strategy in use.
Exiting the Trade
As mentioned previously, only stay in the trade for maximum 10 minutes or until the short term option expires. However, these are only general rules to follow. Every trader should set profit targets that fit within their overall trading system and bankroll. 20-minute binary options are extremely fast moving and can change in price in a split of a second. That means that both profits and losses come can come quickly. Watch the underlining security carefully after placing your trade. Have a set percentage on how much you want to make from each trade and exit the trade once you have reached that goal. Conversely, have a
Why This Strategy Works
The core of this strategy is based on using various tools to confirm the same thing. That being a short term bearish sentiment in the market. To make money in any market, a trader does not have to predict large
Potential Problems
Since this is such a short term trading strategy, timing is everything. The window of opportunity to place a trade with this approach is extremely small. Many traders may run into problems by hesitating or second guessing themselves. This is where experience and practice will be advantageous. Trust the system and make sure that all of the indicators are displaying the proper signs to enter the trade. If all the conditions are met, then enter the trade. If not, there is no need to force it. Be patient and wait for the right setup.
Entry Check List
- Parabolic SAR indicator is displaying a dot above AND directly next to a red candlestick on a 5-minute chart.
- The following 5-minute candlestick on the chart is located close to the bottom Bollinger band.
- The MACD has crossed over and falling below the signal line.
- Volume is increasing.
Suggestions
First, practice using this strategy with a demo account or using some sort of simulated trading software. Many binary option brokers, including Nadex, offer a free demo account through their website. This is the safest way to test new strategies out and get a feel for what it is like to place real time trades. Understanding the concepts of a strategy is the first part to being a successful trader. The next part is putting that knowledge to work. The best way to do that is to practice and become comfortable using a new strategy such as this. Secondly, once you have decided to trade with a real money account, keep your positions small relative to your overall account balance. No single trade should either make or break you. The rule of thumb that many traders adhere to is risking a maximum of 10% of your overall account balance for a single trade. For an absolute beginner, I would recommend that number be closer to 5%. As you gain more confidence in your abilities, you can increase this until you find a percentage that suits your trading style. Lastly, keep a trading journal that keep track of every trade made using this strategy. This is the best way to make sure that mistakes are no repeated and to improve on the execution and exit of trades. Keeping a journal can be extremely helpful and will decrease the learning curve of a strategy for any trader — new or experienced.
Final Thoughts
Use information in this article to further understand various trading techniques. There is no such thing as the Holy Grail of trading strategies. No system is perfect. A major focus of any trader should be to consistently keep learning, evolving, and improving their own trading style. The different components of this trading system can be applied to other strategies as well. Shaping and molding your own strategy as a trader should be a top priority. Hopefully, this guide provided some insight towards effectively placing


