
Bollinger Bands in Binary Trading
We have been talking about indicators that allow you to monitor price action movement and allow you to make trades based on informative tools. Another indicator that binary option traders employ is the use of Bollinger bands. This indicator requires knowledge in candlesticks and moving averages, both discussed in our previous articles. Now, we will use these knowledge to make use of yet another indicator that has helped many binary options traders.
What are Bollinger Bands?
A Bollinger band is a pair of trend lines plotted in a price chart two standard deviations away from a moving average. These bands consist of a center line and two price channels, or bands, above and below it. The center line is an exponential moving average while the bands are the standard deviations of the stock being studied. The bands will expand and contract as the price action of an asset becomes volatile, when there is an evident expansion of the bands, or becomes bound into a tight trading pattern, as is evident in a contraction of the bands.
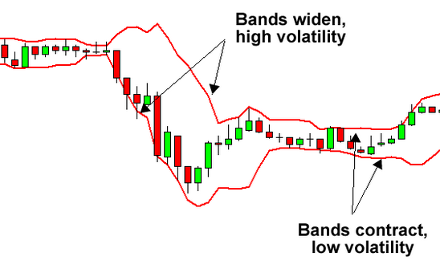
Because standard deviation is a measure of volatility, these bands adjust themselves to the market conditions. When the markets become more volatile, the bands widen, or they move further away from the average, and during less volatile periods, the bands contract, or they move closer to the average. The tightening of the bands is often used by technical traders as an early indication that the volatility is about to increase sharply.
Using this principle with the help of Bollinger bands makes it one of the most popular technical analysis techniques in binary options trading. The closer the prices move to the upper band, the more inclined binary options traders are to purchase call options, and the closer the prices move to the lower band, the more inclined they are to purchase put options. Volatility allows traders to gather important information on how the market is trading.
The Bollinger Bands were invented in the 1980s by John Bollinger. This famous trader said that volatility was dynamic in nature and not static, and that adaptive methods should be made to track the changes of volatility. According to him, Bollinger bands can show the relationship between the low and high prices of an asset. Techniques based on this indicator use the premise that low prices are found near the lower band while high ones are located at the upper band. Because of this, Bollinger bands are particularly useful in pattern recognition.
How to Make Out Bollinger Bands
One of the most challenging aspects of trading is to determine the trend. In this case, the binary options trader may use certain techniques with the bands to help him determine the trend. Firstly, this setup requires patience and discipline, as the bands will tell us whether the price action is an uptrend or a downtrend. Using candlesticks for this technique is preferred, as one can see the closing price better than any other type of chart.
An understanding of price support and resistance is also critical for determining the entry point. We have resources on the topic, as well as other numerous helpful articles that will help you strategize your trading techniques.
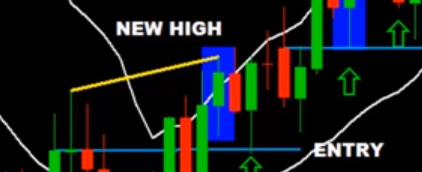
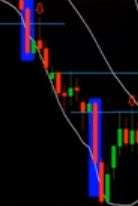
Let us start by looking at the figure below, showing a historical trade closing above the upper Bollinger band.
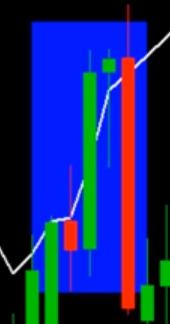
The first step is to look for a candle that clearly closes above the upper Bollinger band line. For instance, like the figure below, the closing price has closed above the Bollinger band line. The other candles to the left of our focus have not closed above the Bollinger band line. Only their shadows have gone above the line. But the actual candle have closed below the upper Bollinger band line.
This occurring is critical as the part of the first criteria of the trade has been met. Once the binary options trader clearly sees that the green candles closed above the upper band, he must ensure that when this occurred, a new high was also generated. This is evident as we zoom out of the chart.
For example, when the candle closes above the upper band, we also have that price generate a new high. This is critical as this part of the setup defines the direction of the trade. This particular setup shows an uptrend, once these two elements of the trade has been met.

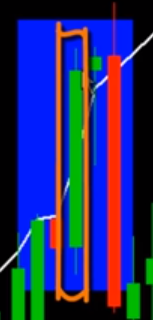
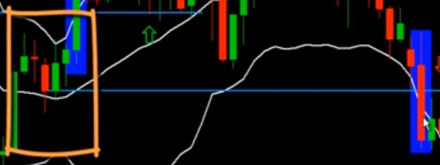
Second step of this strategy is to look for a specific entry point, so you know when to purchase a call. This is where previous price highs and lows comes into play, as these are the points that the binary options trader need to use as reference to execute the trade. When a green candle closes above the band and a new high is generated, we need to wait for the market to retrace back to a previous high.
Finding out the relevant high to use is required before executing the purchase. For example here, the price acted as a magnet and retraced back to the previous price highs, paused, then continued to move higher in the uptrend.
A stop loss, can be tied below the previous high levels.
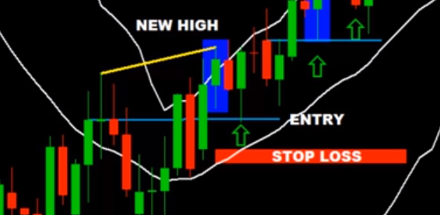
And, new highs can be targeted in terms of profit points.
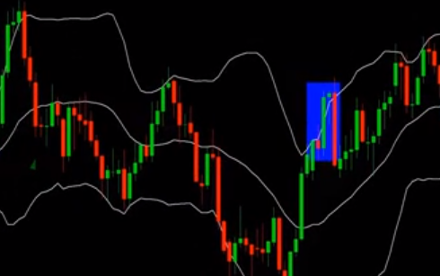
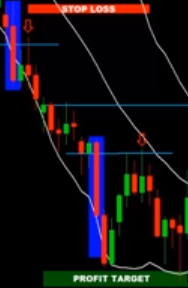
Next, let us take a candle that closes below the lower band.
As can be seen, the market is trending down. The focus candle has closed well below the lower band. Furthermore, a new level has also been established, as can be seen with the later lows forming from the previous lows.
Once this criteria has been met, look for an entry point, or a point to enter the trade where the price levels go down. Traders also need to look at previous lows that act as resistance and define the entry. Once the price retraces from the point shown below, we can predict a downtrend in the price levels.
A stop loss is placed above the entry, and new profit targets can be seen in the lows. With this technique we are defining the trend via the Bollinger bands using price levels as a form of entry and exit.
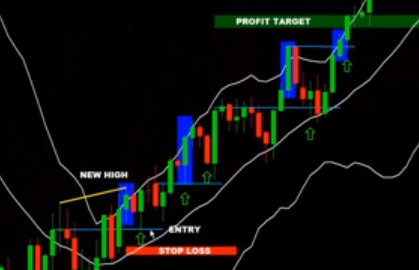
As we look at longer historical trends, we can see that this setup over and over. Shown below are more examples of these trades.
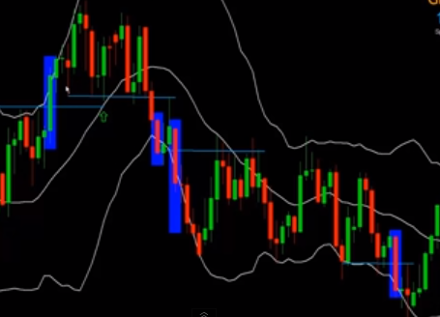
In essence, trading with Bollinger bands can help determine specific trade setups. It is up to the binary options trader to make informed decisions based on this indicator of price movement.
Our company can provide you with more indicators that you will find essential in binary options trading. If you are just new to binary options, take a look at our roster of top binary brokers to get you started.