
Wedges — Falling and Rising Patterns
A binary options trader will often come across two important chart patterns namely the rising wedge and falling wedge. Depending on whether the pattern develops after an uptrend or a downtrend, the rising and falling wedge patterns can result in a reversal or continuation of the trend. Thus, a proper understanding of these patterns is highly necessary for a binary options trader to select a suitable contract to trade and time the entry.
Identifying a Rising Wedge Pattern
A rising wedge is a bearish pattern, which develops when a security’s price makes higher highs and higher lows. It is a common and reliable ‘sell’ pattern with clear indication of entry and exit levels.
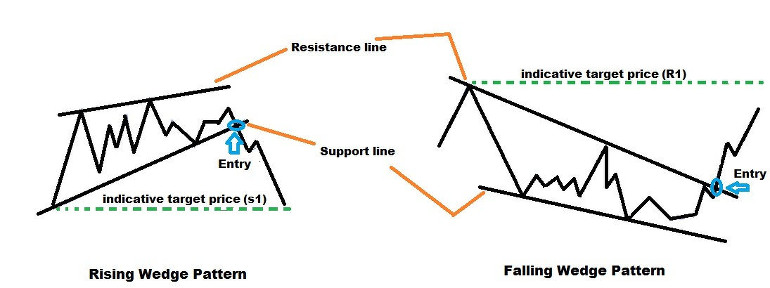
A rising wedge pattern can be seen during an uptrend as well as a downtrend. A price reversal is expected when the pattern develops after a prolonged uptrend in price. On the other hand, a continuation of the downtrend is seen when the pattern is formed after a decline in price. The pattern is considered to be complete when the price, aided by a rise in volume, breaks down below the support line as shown in the image below. Additionally, the following rules govern the formation of a rising wedge pattern:
- A rising wedge shaped pattern should take at least three weeks to develop.
- A minimum of five unique price points (three higher highs and two higher lows, or vice versa) must be used to draw the trend lines.
- The volume should rise when the trend line (support) is broken.
- The momentum should weaken when the price nears the apex of the pattern.
It should be remembered that the reliability of the pattern increases when the base becomes wider. The lowest price within the pattern would be the first target price during the decline.
Binary Option Trades with Rising Wedge Pattern
1min / 30min / 1hr options
A binary options trader can purchase a 1min / 30 min / 1hr put options contract soon after the price breaks below the support level (lower boundary). Since the price breaks below a formidable trend line developed over a period of more than three weeks time the probability of an immediate reversal is almost negligible. It should be noted that there is no specific time period for the
Another point to remember is that the put options contract should be bought after monitoring for a rise in volume during the
One touch put option
Before purchasing a one touch put option contract, a trader should compare the probable target price (lowest price with the pattern) with the broker’s put option price target. If the probable target price is lower than the price target set by the broker then a one touch put option contract can be bought. Again, the volume should have risen considerably during the break down of the support level. Additionally, a trader should refrain taking positions before the support level is broken convincingly with a rise in volume. If the momentum is not strong enough to trigger a sharp decline in price (below the price target set by the broker) then the trade would result in a loss.
Double one touch option
A trader should consider buying a double one touch option contract only under the following situation:
- When there is a scheduled high impact news announcement.
It should be noted that a double one touch option contract should be the last resort of a binary options trader as far as a rising wedge pattern is concerned. The reason is that even if the volume is not appreciable during the
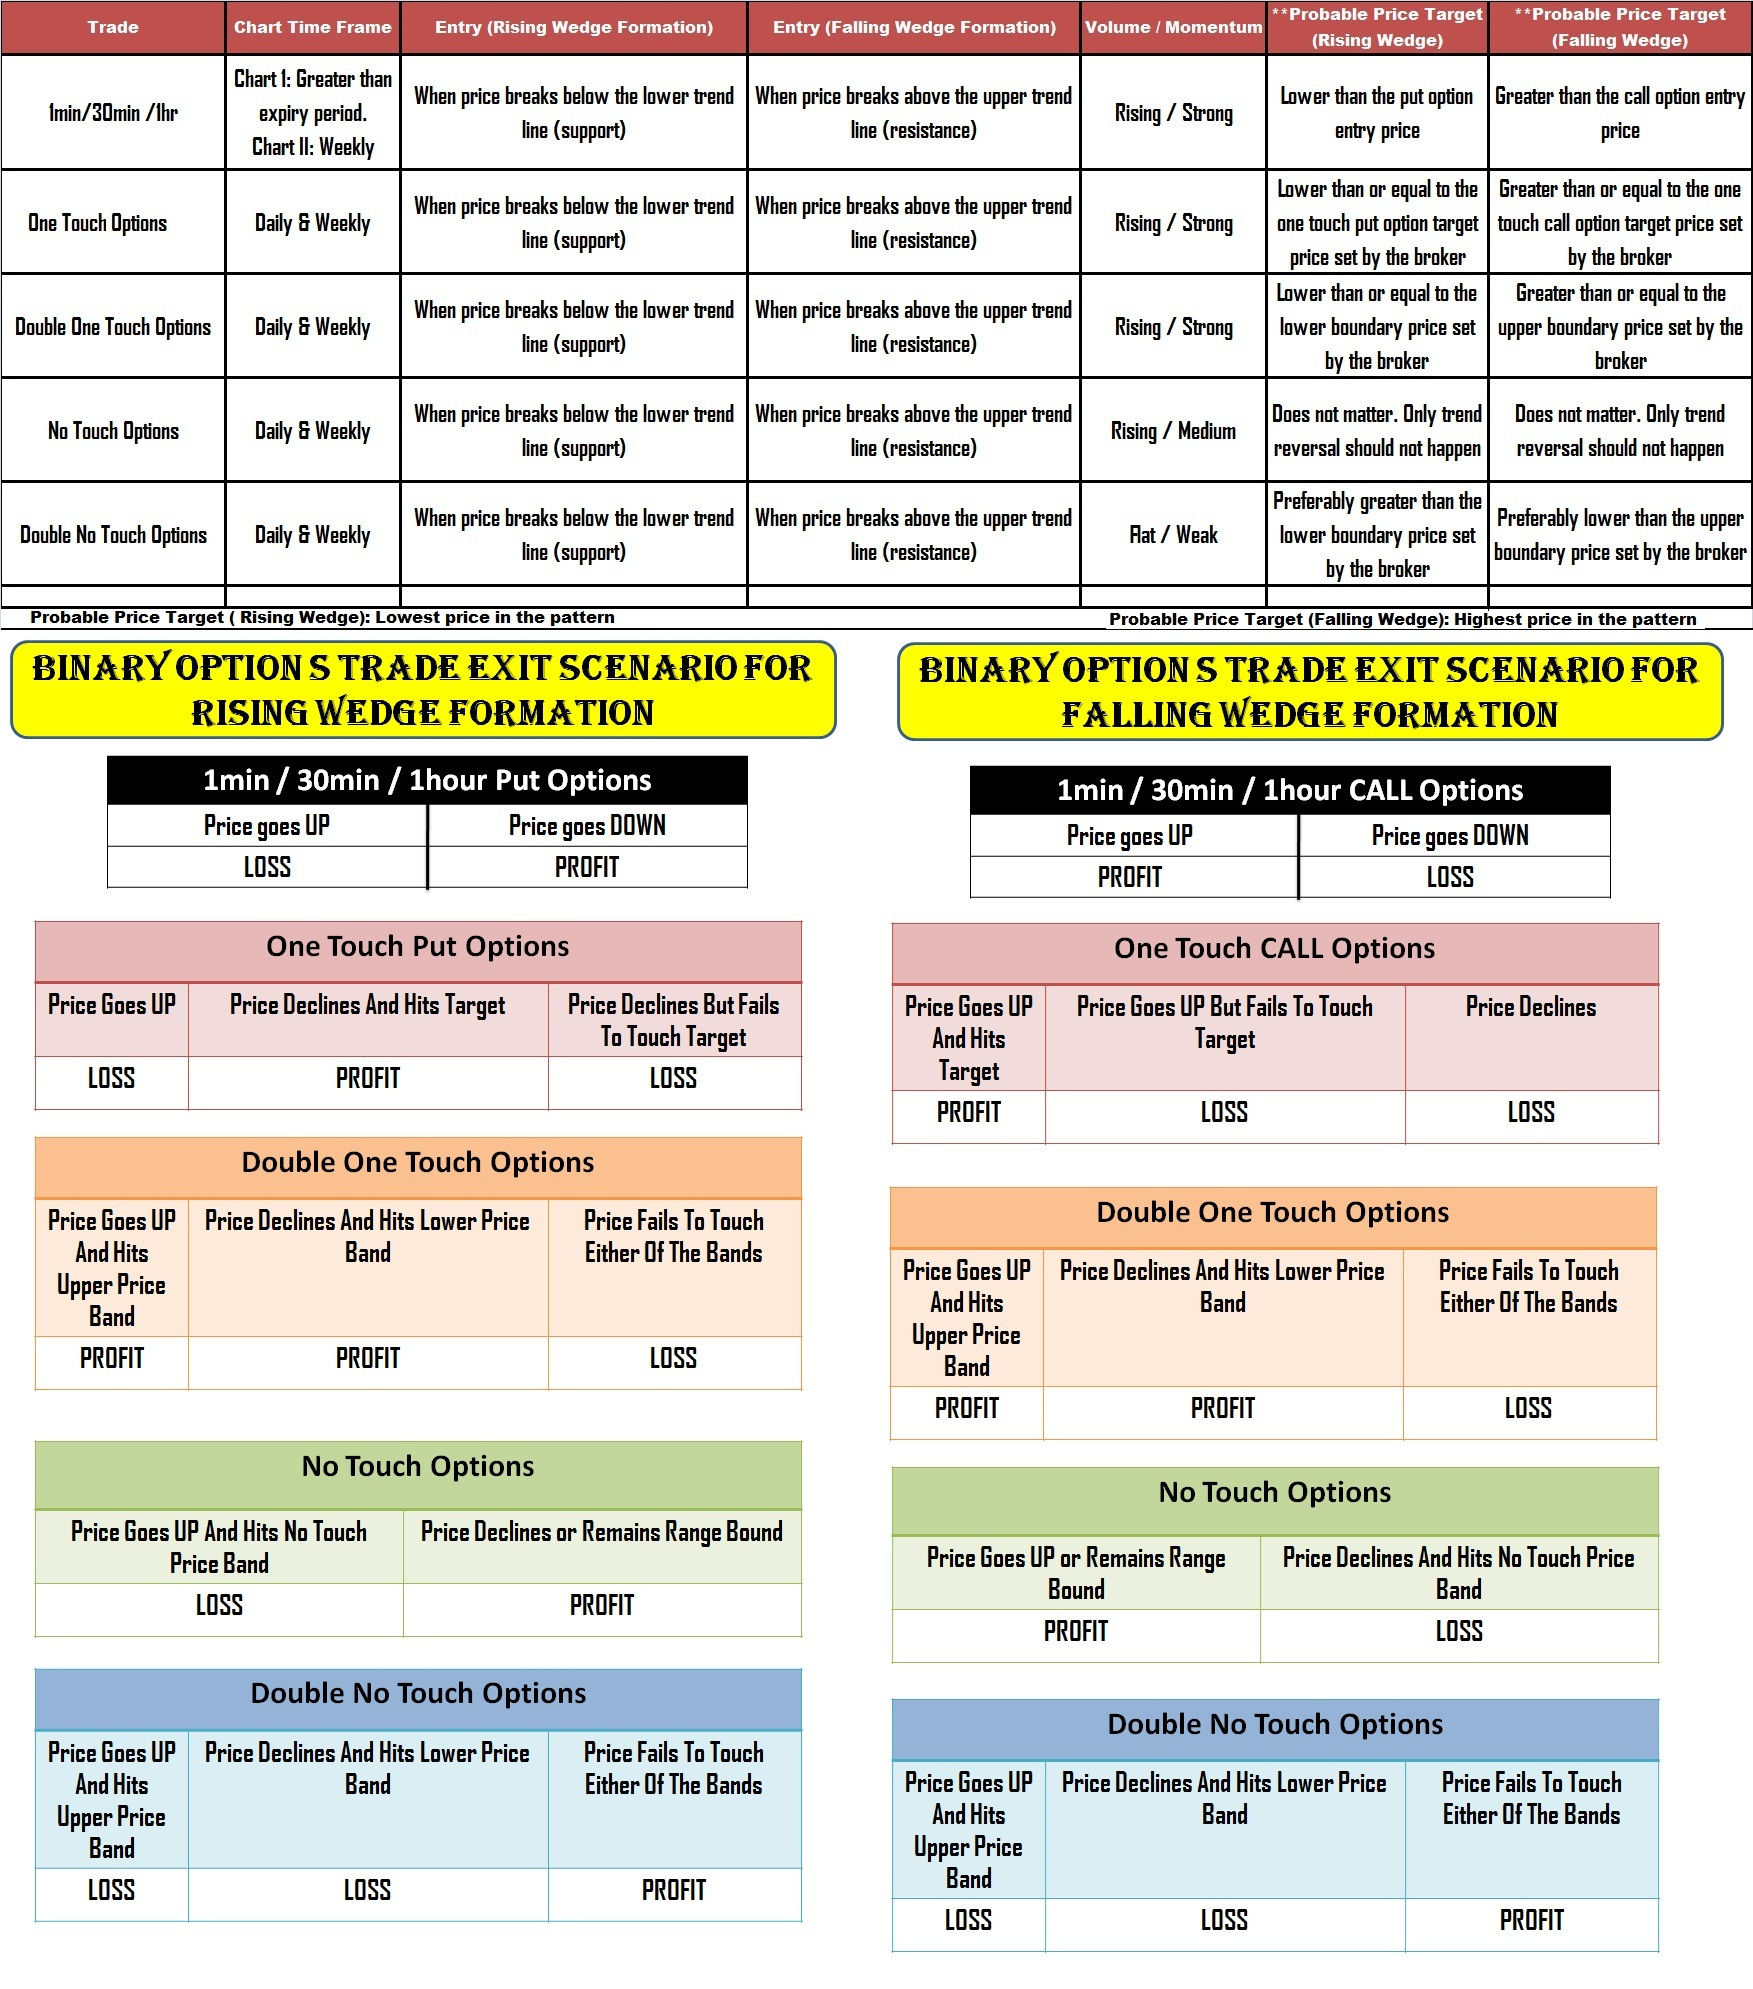
No touch option
A no touch option is possibly the best contract a binary options trader can choose when the price breaks below the lower trend line of a rising wedge pattern. Being a highly reliable bearish pattern, the probability of a price reversal is negligible. Thus a trader can safely purchase a no touch options contract as soon as the price breaks below the support level. Since there is no price target to achieve, a trader need not anxiously monitor for a deep decline in price. Only high impact news favoring a price rise will turn the tide (options will expire out of money) against the trader.
Double no touch option
A double no touch options contract can be bought when the following three conditions are satisfied:
- Price breaks below the support level without noticeable increase in the volume.
- Momentum is weak.
- There is no scheduled high impact news announcement.
Once the support level is broken the price will remain range bound. Only fresh news can trigger further decline or reversal in price. Since the volume and momentum is not encouraging, a trader can hope that the lower boundary price set by the broker remains untouched or breached following the
A sudden rise in volume accompanied by a gain in momentum would increase the price volatility of the underlying asset. Such a scenario will render the double no touch options contract expire out of money.
Spotting a Falling Wedge Formation
When the price of a security makes lower highs and lower lows, it leads to the formation of a bullish pattern named falling wedge. The pattern is seen during an uptrend as well as a downtrend. If the pattern develops after a prolonged decline in price then it leads to a trend reversal. Alternatively, a falling wedge pattern formed during a price rise results in the continuation of the uptrend.
A falling wedge pattern is confirmed when the price, supported by a rise in volume, breaks above the resistance (upper trend line). A confirmed falling wedge pattern should satisfy the following criteria:
- The time taken for the formation of the pattern should be at least three weeks.
- A minimum of five unique price points (three lower highs and two lower lows, or vice versa) should be used to draw the trend line.
- The break out should be accompanied by a considerable rise in the volume.
- The momentum should weaken when the price approaches the apex of the pattern.
Similar to a rising wedge pattern, the reliability of the pattern increases when the base widens. The highest price within the pattern would be the first target price after the
Using a Falling Wedge Pattern to Trade Binary Options
A falling wedge pattern shares the same characteristics of a rising wedge pattern. The only difference is that the price
A binary options trader can purchase a 1min / 30min or 1hour call options, one touch call options, no touch option, double one touch option and a double no touch options contract when a falling wedge pattern is confirmed by a price
The probable target price for a falling wedge formation would be the highest price in the pattern. Similar to a rising wedge pattern, the volume should increase and the momentum should remain strong during the
A binary options trader with an
You may also be interested in learning about other chart patterns that can be used to trade binary options: