
Head & Shoulders Pattern in Binary Trading
The chart patterns are an outcome of tussle between buyers and sellers to reign over the market. Through chart pattern analysis, a financial market trader will be in a position to forecast a shift in the balance of power and capitalize on the impending price movement. However, in addition to the analysis and forecasting ability, a binary options trader should also be competent enough to select the proper time frame and time a trade entry to realize a profit (in the money expiry). The following discussion, from the perspective of a binary options trader, will provide a detailed insight into one of the common but credible chart pattern namely the “Head and Shoulders”.
All chart patterns can be broadly categorized under two divisions namely the reversal and continuation. A reversal pattern ultimately results in a trend reversal while a continuation pattern only creates a temporary pause in the prevailing trend before the price movement resumes in the same direction. A reversal pattern is further classified as a top and bottom formation depending on its structure and location on the chart.
The “Head and Shoulders Top” and “Head and Shoulders Bottom” pattern, which would be studied in detail here, is a reversal pattern. This means that a trader who comes across such a chart pattern should position the binary options trade in such a way that the trend reversal results in a gain.
Identifying a Head and Shoulder Top Formation
The pattern, which is usually seen at the final leg of an uptrend, is made up of three consecutive peaks. The tallest peak develops in between the two approximately equal peaks on either side. The entire structure resembles the head and shoulders of a human being. Thus, as shown in the image below, based on the position, the tallest peak is referred to as the head while the other two peaks are labeled as the left and right shoulder.
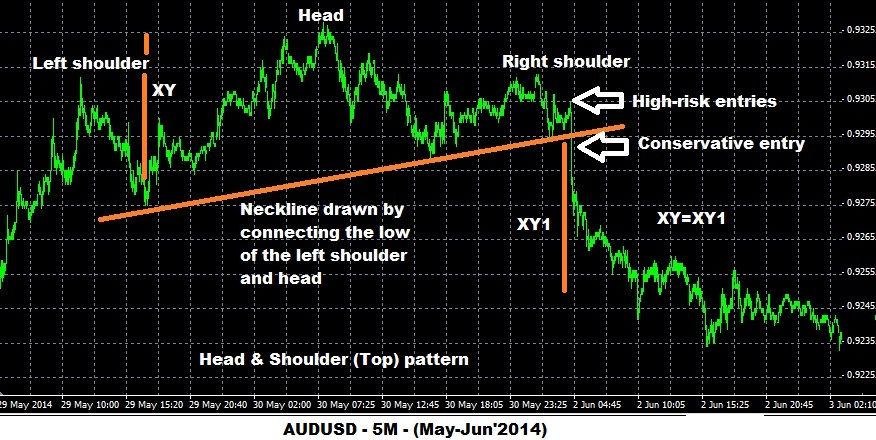
A neck line is drawn by intersecting the reaction lows of the first and second peak. The bearish reversal formation is considered to be complete only when the price, following the formation of the right shoulder, breaks below the neck line. The
Setting up a binary options trade
1min, 30min and one hour trades: A 1min put option trade can be bought as soon as the neckline is broken. Since the fall would be usually steep, there is very less chance for a
Another important point to remember is that the expiry time should be the minimum time frame selected for the chart. As the chart’s time frame becomes smaller, the reversal probability before the expiry time increases. Thus, a 1min trader should preferably use a chart time frame of 5-min and above for identifying and trading a head and shoulder top pattern.
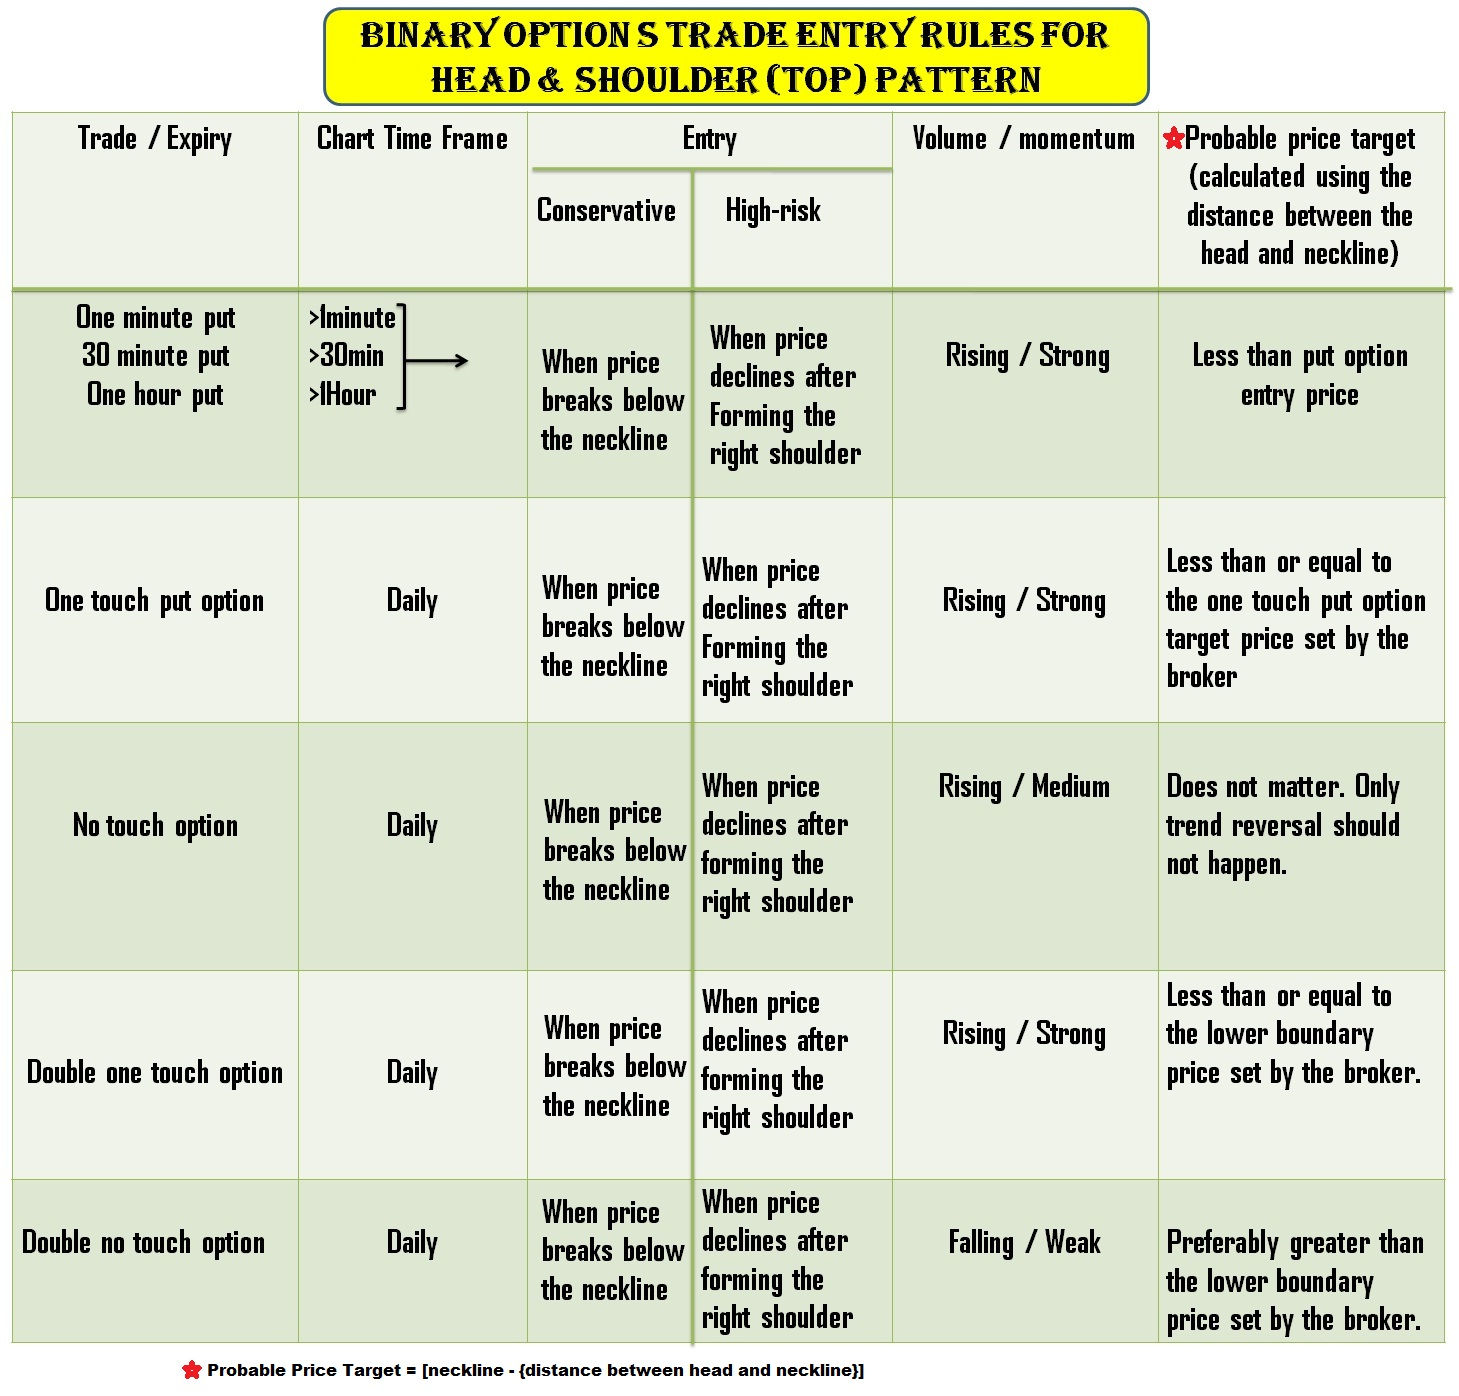
An experienced trader can buy a binary put option trade (30-min or 1hr expiry) as soon as the price starts declining after the formation of the peak of the right shoulder. Since the entry is above the neckline, even a price
One touch options trade
A one touch put options trade can be taken with a binary options broker soon after the price breaks below the neckline. The two criteria to be considered before entering a one touch options trade are:
- Volume: When the neckline is broken, the volume should be remarkably higher in comparison to the volume during the head formation. This is because a rise in volume indicates a strong selling pressure, which is needed for a deep decline in the price.
- One touch price target: The put option price should be less than or equal to the probable target calculated using the distance between the neckline and head. Since the decline should result in touching the put option price at least once before expiry, a far off target will only lead to a out of money scenario.
If the pattern satisfies the volume and price target (set by the broker) then a one touch put option can be taken as soon as the price breaks the neckline.
High risk traders can enter a one touch put option trade when the price starts declining after forming the peak of the right shoulder.
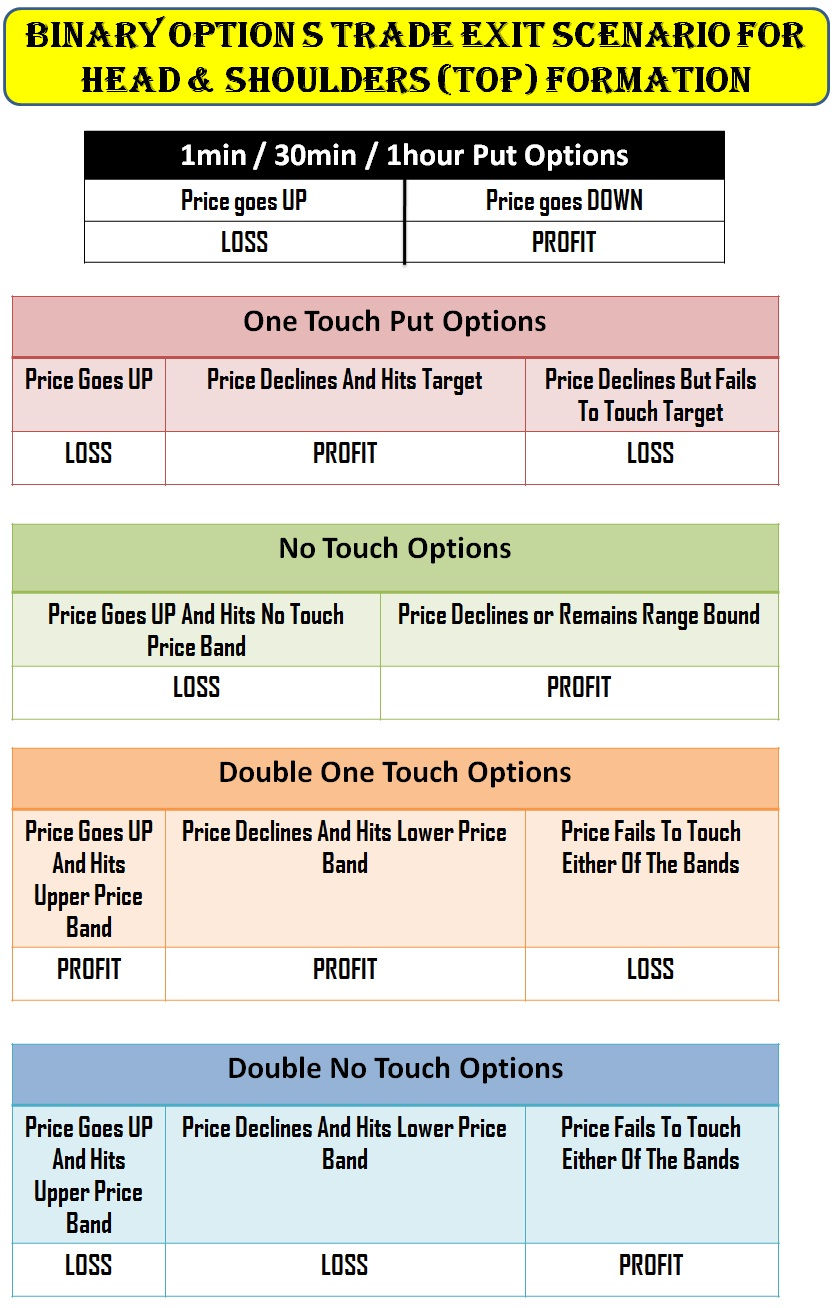
Lack of momentum or reversal will result in a loss (out of money expiry).
A daily time frame can be used to identify the H&S (top) pattern and enter a one touch binary option trade.
No touch options trade
A “no touch” option trade can be taken under two circumstances.
- To add up to the existing one touch options trade position.
- When the one touch options target price (offered by the broker) is too deep and far away from the probable target price calculated using the neckline in the H&S (top) pattern.
The first option is for those traders who are experienced in binary options trade and have an
Taking both one touch and no touch option trade is quite risky in the sense that a trend reversal would result in a loss from both the trades.
The second option is for both beginners and regular traders. There are situations where the target price (set by the broker) to be achieved by a one touch put option trade would be far off and unrealistic. Other than that, there may be situations where a trader would have identified the pattern a bit late (after the price had broken below the neckline). In such cases, a trader should opt to buy a no touch option with price above the neckline.
Unless and otherwise there is a trend reversal, the price would not cross the neckline thereby giving higher probability of success to the trader.
Even before taking a no touch option trade, a
Double one touch options trade
A double one touch options trade is not advisable for a Head & Shoulder (top) pattern. However, if the trader is inclined to try out new strategies then a double one touch options trade can be taken under the following circumstances.
A double one touch option contract should be considered only when a trader is suspicious of a strong
When there is a sharp reversal in trend after the price
As long as the momentum is strong enough to force a deep decline or sharp recovery, the trade will expire in the money.
If the news halts the decline and price remains range bound then the trade will result in a loss.
Double no touch options trade
A double no touch options trade is feasible only when the neckline is broken with a poor volume. The price of the traded asset would then display a pull back and remain range bound between the head and the neckline. As long as there are no major news announcements to trigger an uptrend or downtrend in the asset, the trader can exit the trade with profit.
News related spike above the head or below the neckline would see the contract expiring out of money.
Spotting a Head and Shoulder Bottom Pattern
Occasionally, a Head and Shoulder pattern develops in an inverted manner at the end of a down trend. Technically, such a development indicates an end to the down trend and probable reversal in price. Thus, it is called as a bullish reversal pattern. Based on its appearance, the formation is also referred to as inverted head & shoulders.
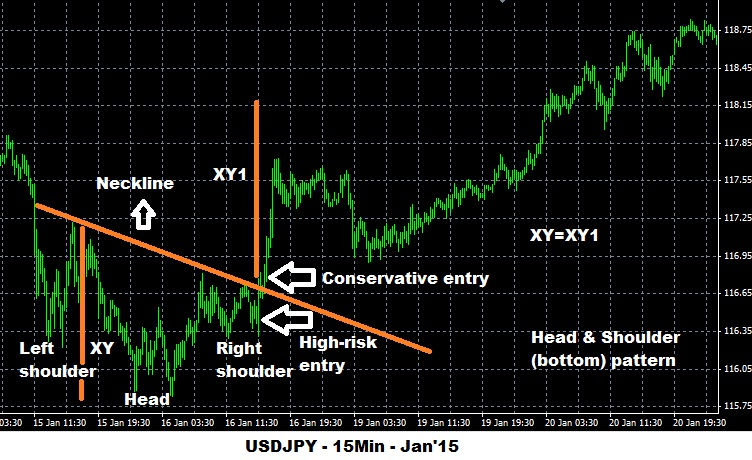
In the case of an inverted Head & Shoulders pattern, the neck line is drawn by intersecting the reaction highs of the first and second trough. The bearish reversal formation is considered to be complete only when the price, following the formation of the inverted right shoulder, breaks above the neck line. The
In this case, the target price is calculated by adding the distance between the deepest trough and the neckline to the latter.
Setting up a binary options trade
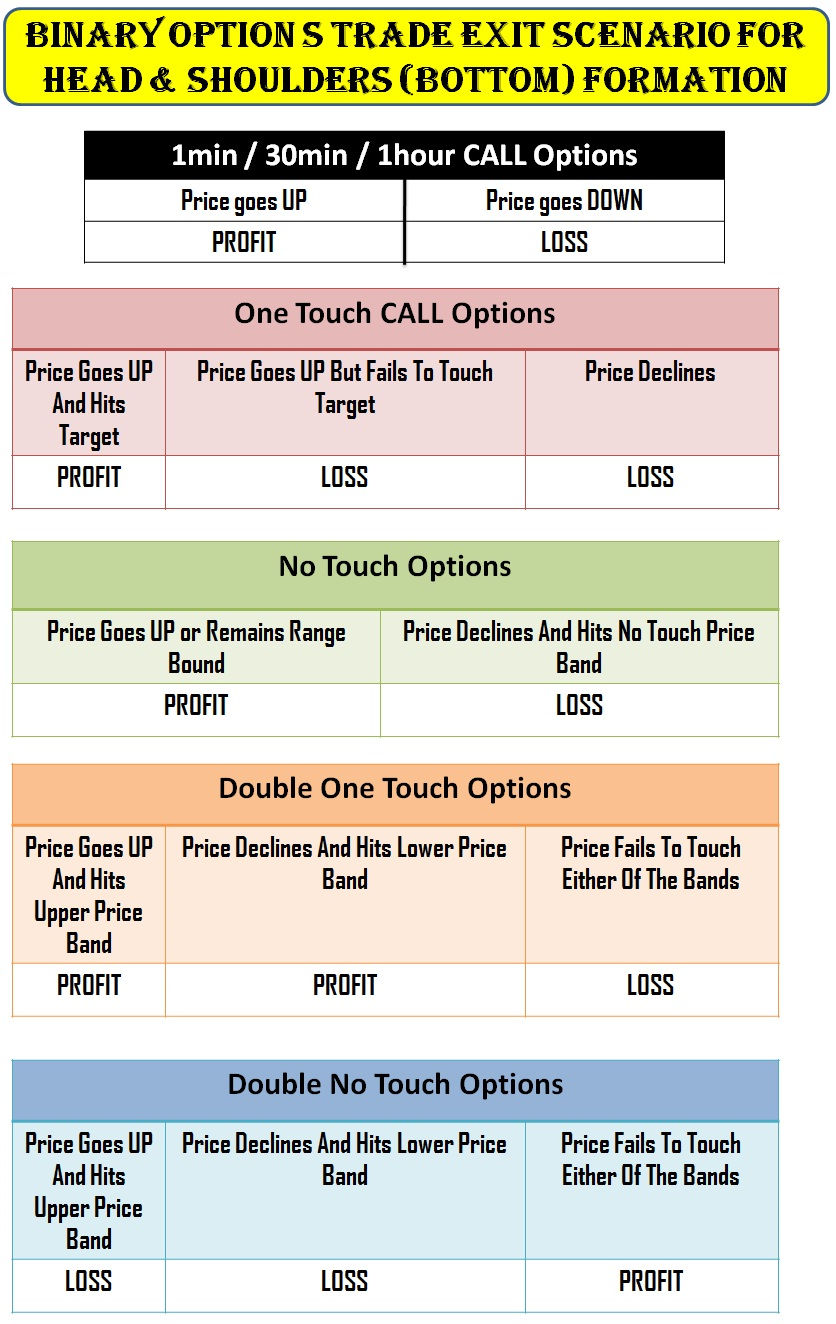
In the case of an inverted H&S formation, all the binary options trade (1m, 30m 1hr, one touch, no touch, double one touch and double no touch) can be taken in the same fashion as discussed above (H&S top pattern). The only thing to remember is that a suitable binary options trade should be taken when the price breaks above the neckline.
All other conditions (volume and momentum) to be satisfied to enter a trade is similar to a H&S top pattern as shown in the image below.
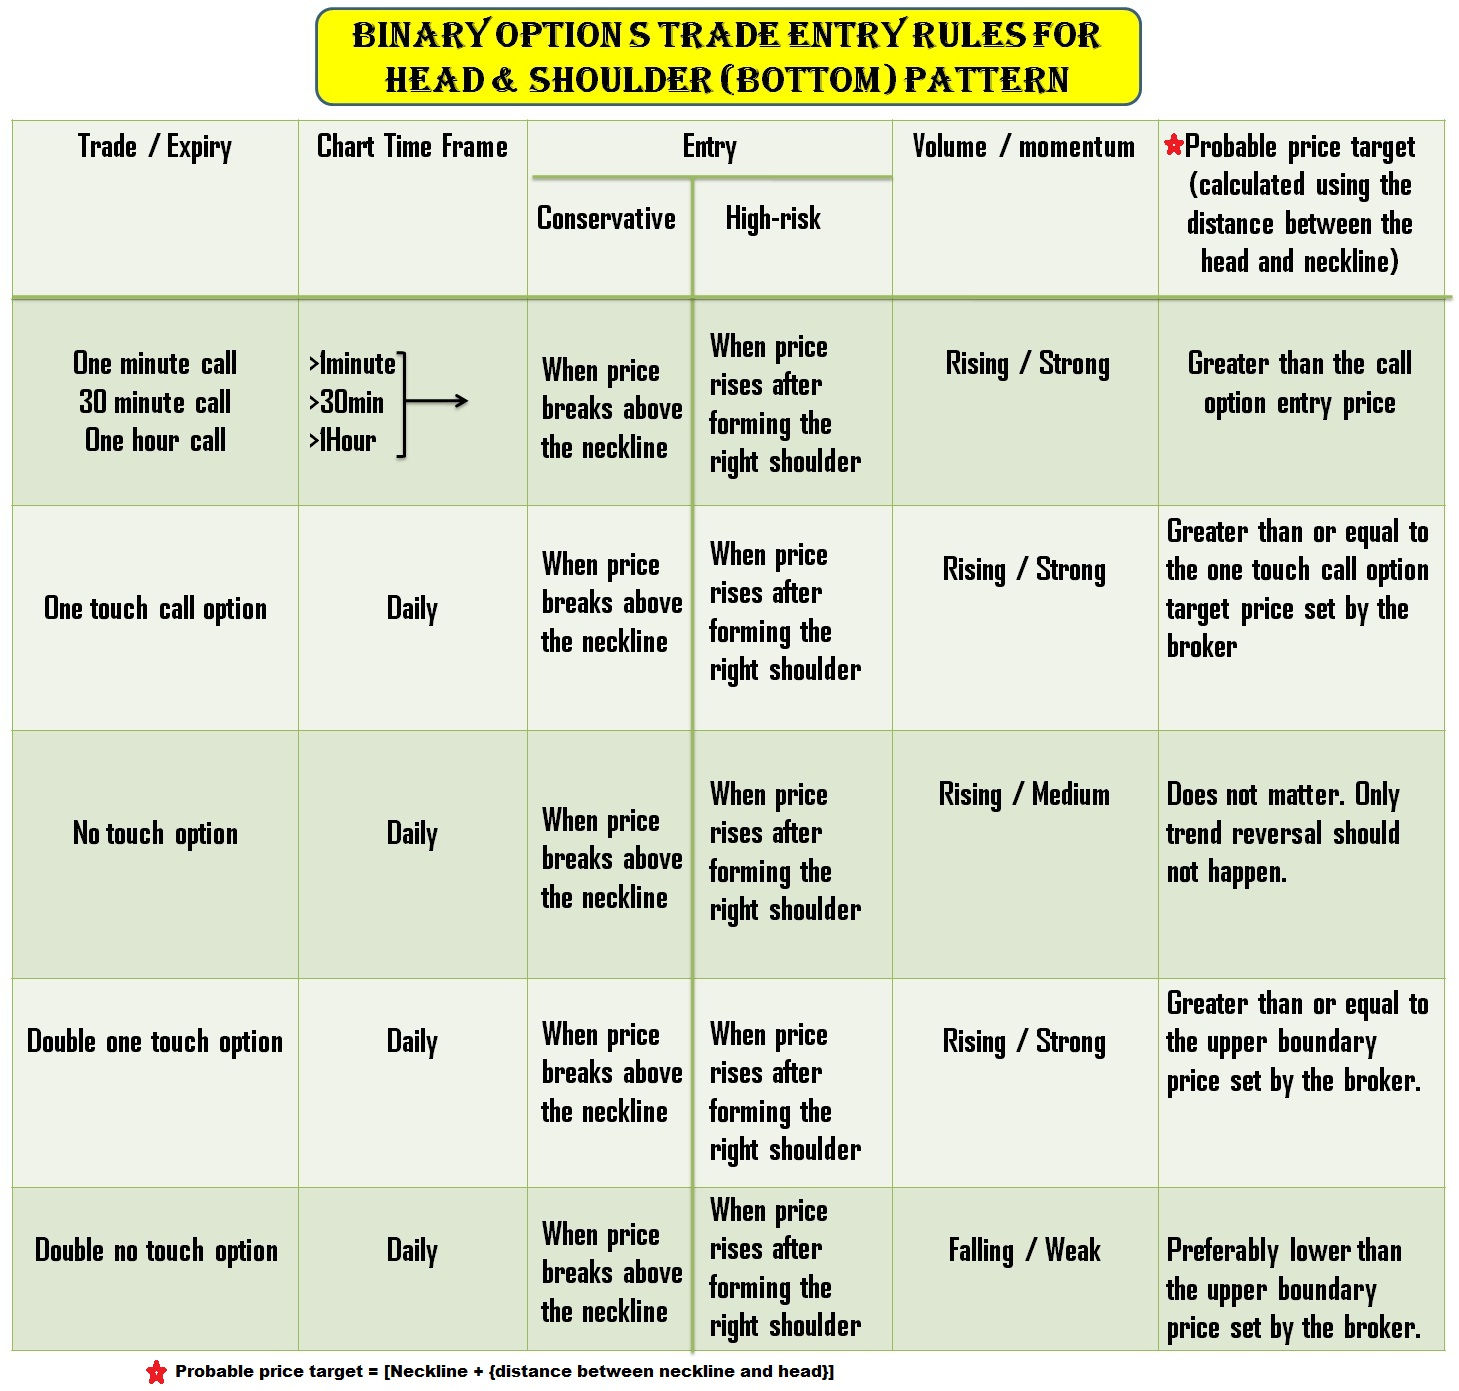
Alternatively, a high risk trader can enter a trade once the price starts climbing upward after the formation of the final trough (inverted right shoulder).
A Head and Shoulder pattern can be easily identified and traded with a high probability of success. All that a binary options trader should do is to buy a suitable binary options contract (as the situation warrants) and wait for expiry period to reap rich rewards.
You can practice trading
You may also be interested in learning about other chart patterns that can be used to trade binary options: