Using the Parabolic SAR with Binary Options
The parabolic SAR is an indicator that is commonly used by binary option traders to determine
How It Works
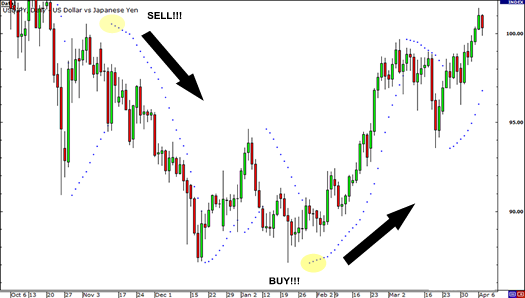
The parabolic SAR is graphed on a trading chart by plotting small dots above or below the price. If the dots are below the candlesticks, this signals a bullish sentiment in the market and traders should look for opportunities to buy. On the other hand, if the dots are above the candlesticks, this represents a bearish sentiment in the market. In this case, traders are looking for a decline in price and chance to sell the underlining asset. This indicator is very mechanical in nature. It is important to note that this indicator assumes that the market is always moving either up or down and that the trader is fully invested in either a long or short position. You can view a chart with the parabolic SAR indicator applied to it below.

Traders should look to enter positions when the parabolic SAR shifts from below to above the candlesticks price or vice versa, depending on the sentiment in the market. If used on a 5-minute chart, this can provide a good opportunity for binary options that are expiring within an hour or even a shorter amount of time. Again, this indicator does a great job at signaling short term trends, so it works well with options that do not have much time left to expire.
When to Use
This indicator can be very useful within certain market conditions. It is generally most reliable when the market is trending in one direction. This is because the SAR is designed to find the security’s general trend and follow it like a trailing stop. It works in both uptrend as well as downtrend and should be used to help a trader find entry and exit points within those trends. Look at this indicator being used on a 5-minute trading chart below. It can provide many trade signals so that a trader can constantly have money at work. Even though this can be a powerful tool for a trader, it should never be used solely on its own. It is most efficient for trading binary options when combined with other indicators.

When Not to Use
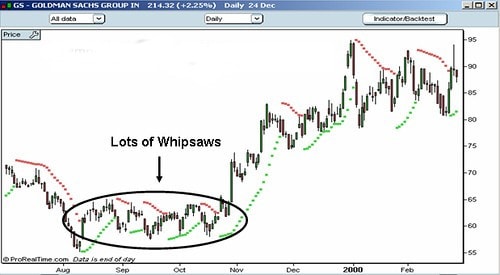
This indicator is least advantageous when the market is ranging in price. This is represented when the dots are appearing both above and below candlesticks consecutively on a chart. A picture of this kind of situation can be found below. This often causes false buy or sell signals and can portray an inaccurate picture of the direction that the market is moving in. This also is a signal of lack of volatility in the underlining market which is bad for placing short term binary option trades. Take a look at a ranging market.

Conclusion
The parabolic SAR is an important component to any binary option trading strategy. When used in the ways mentioned in this article, it can give a trader the ability to spot short term trends and price movements. Remember that using this indicator along with other trading tools will give insights on the direction the market is moving.

