
Trading Binary Options with TD Sequential
TD Sequential is an indicator that tries to predict when the current trend loses its momentum and when it reaches its top or bottom. The indicator is especially useful for
What is different when trading binary options with TD Sequential?
Usually, a trader can enter a position using suggestions from TD Sequential and then just wait when prices go his way. There is always a risk, of course, but it can be mitigated by good
Using TD Sequential with Up/Down binary options
Using perfected Setup
When the price flips in the opposite direction to the previous trend, TD Sequential starts a process called Setup, which ends after nine consecutive bars (on a bar chart) with each bar recording a close that is higher (in case of the Sell Setup) or lower (in case of the Buy Setup) than the close for bars earlier.
Experts recommend waiting for a perfected Setup — when the low of the bar 8 or the bar 9 is lower or equal to the low of the bars 6 and 7 in case of the Buy Setup or the low of the bar 8 or the bar 9 is higher or equal to the lows of the bars 8 and 9 in case of the Sell Setup.
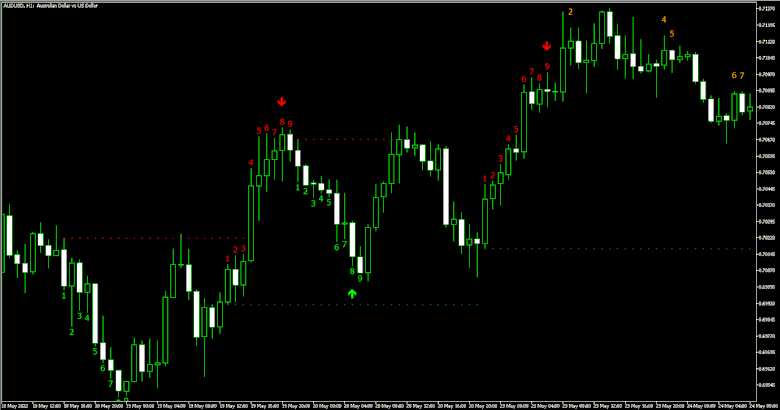
Usually, it is considered a relatively safe bet to buy when the Buy Setup is perfected and sell when the Sell Setup is perfected. In the case of binary options, that should mean you can bet on the market going down after the perfected Sell Setup or go up after the perfected Buy Setup. But if it is really the case? Look at this hourly chart of AUD/USD:
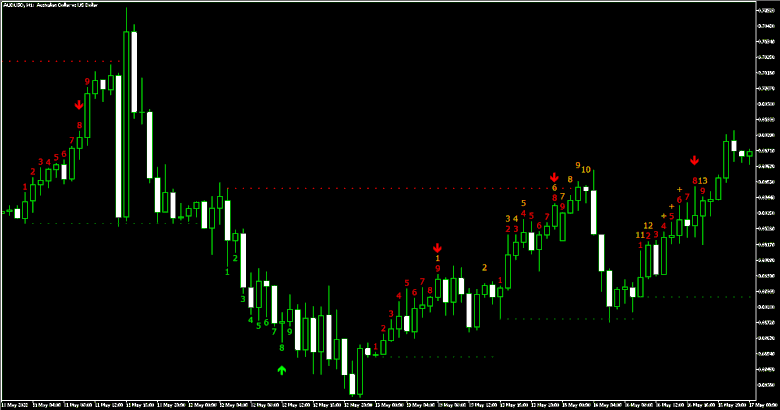
Here you can see three perfected Sell Setups in a row. Furthermore, one of them is near the resistance level without breaching it. This is considered a strong sell signal. Surely, you can safely bet on the market going down? Look what happens next:
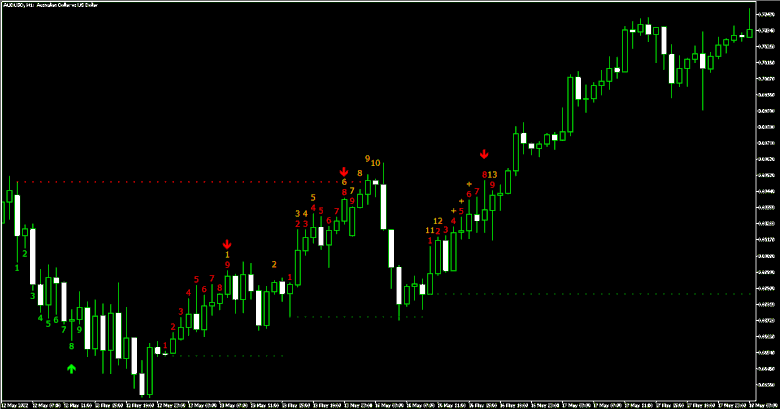
While the market had a
Does that mean Buy and Sell Setups are completely useless? Not really. Just look what happens next:
The market meanders before the price flips and the Buy Setup starts. What if you decide to bet on the market going down from here? And where to plan an exit from the market if you decide to do so? As TD Sequential suggests that the market runs out of momentum at bar 9, it makes sense to plan the expiry date of your binary option at that moment. In the current example, entering the market at bar 1 on an hourly chart, you should bet on the market is lower 8 hours from now. And look what happens next:
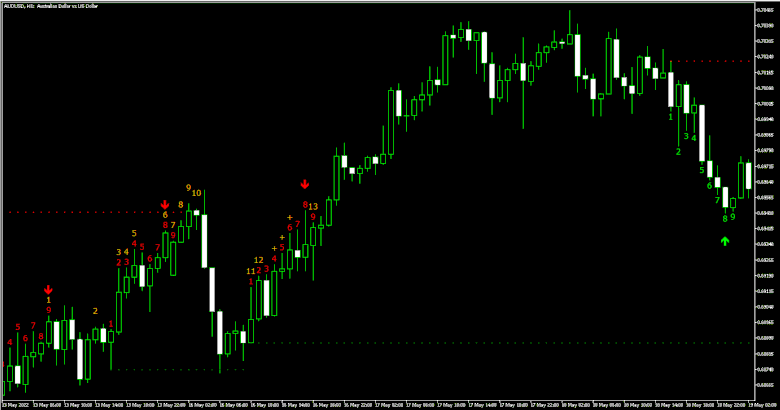
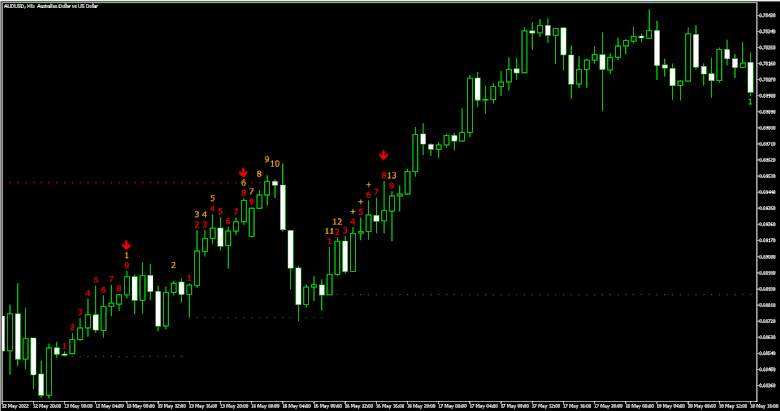
Indeed, the close of bar 9 is below the close of bar 1, meaning that you would have guessed correctly. But one instance does not mean much and certainly does not make a rule. Considering that the Buy Setup ended up being perfected, what if you would have waited for a bullish price flip and a start of a Sell Setup to bet that the close of the bar 9 will be higher than the close of the bar 1. Well, just look for yourself:
Yes, indeed this would be a winning trade as well. And after analyzing the historic data as well as making a few test trades, the conclusion is that it seems to be an extremely reliable trading strategy.
So, here is the basic idea of the strategy:
- Wait for a perfected Buy or Sell Setup.
- Wait for a price flip and a new Setup opposite to the previous one (Buy Setup if the perfected Setup was a Sell Setup, Sell Setup if the perfected Setup was a Buy Setup).
- Bet on the market going higher if the perfected Setup was a Buy Setup, bet on the market going lower if the perfected Setup was a Sell Setup.
- Put an expiry date of the binary option at 9 — x, x being the number of the bar of the new Setup at which you have entered the market. For example, if you have entered the market at bar 3 on an hourly chart, set the expiry date for your binary option at 6 hours from now.
Using support and resistance levels
One of the reasons some traders prefer TD Sequential is that offers support and resistance levels. Experts say that support and resistance provided by those levels are usually strong, and you can usually rely on prices moving inside the range between the support and resistance levels. Consequently, a breakout above resistance or below support is usually followed by a strong move in that direction.
It looks like this provides a good and simple strategy for binary options traders: bet on the market rising higher after prices break above resistance and bet on the market moving lower after prices break the support level. But does it work in practice?
At first glance, that is the case. On charts, you can find plenty of examples of when a breakout is being followed by a strong move in the appropriate direction. For example, look at this hourly chart of USD/CAD:
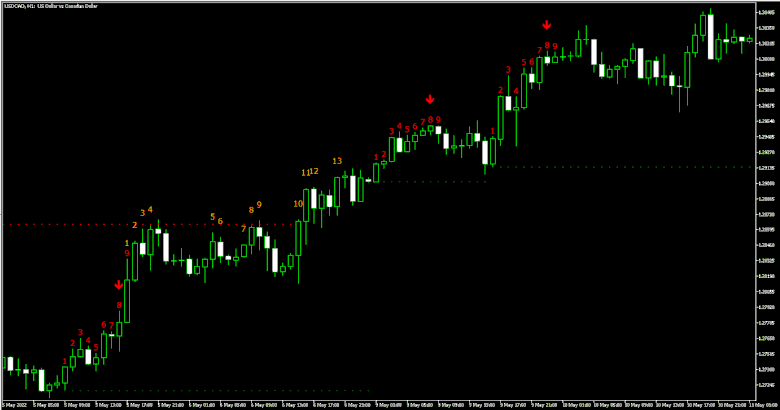
The breakout above the resistance level was followed by a strong move to the upside. That seems to support our strategy.
Here is another example:
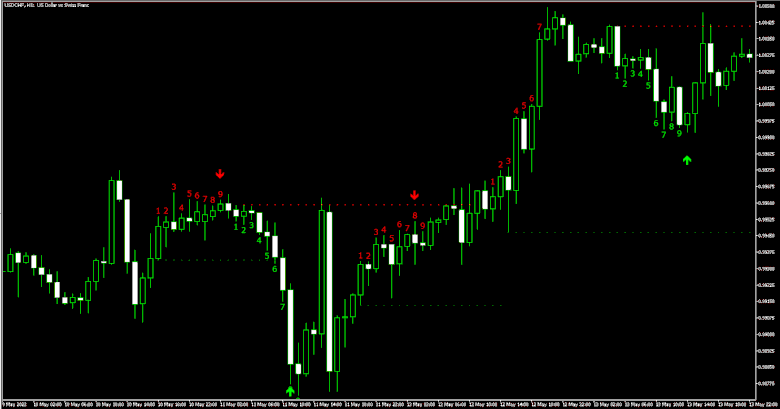
On this hourly chart of USD/CHF, prices demonstrated a sharp drop after breaking below the support level and an even sharper rally after breaking the resistance level. So far so good. But look at what happens next:
Prices move above the next resistance level. But instead of rising higher, they just move sideways for a short while before crashing down.
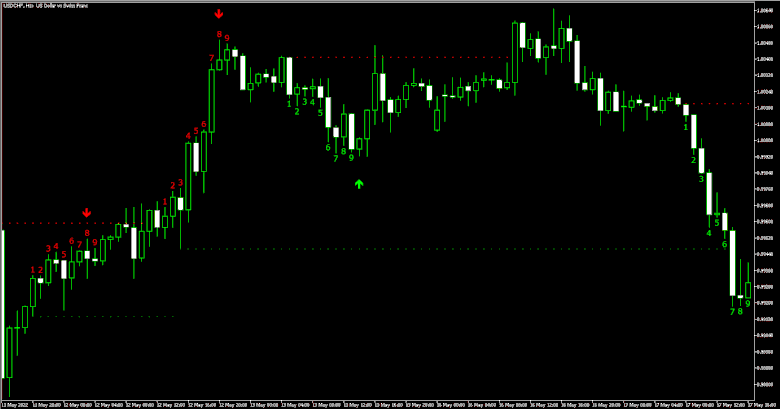
This 4-hour chart of NZD/USD shows the support and resistance levels both working and not working:
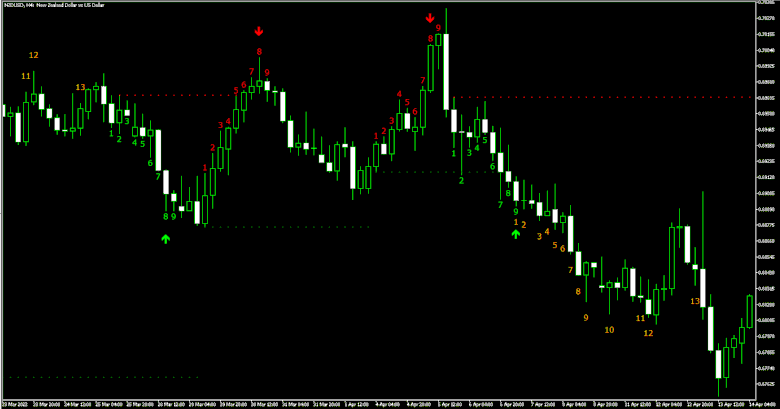
Prices rose above the resistance level but that did not lead anywhere. Yet the breakout below the support level was followed by a strong move further down.
Overall, it looks like the strategy using support and resistance levels of TD Sequential is not nearly as reliable as the strategy using perfected Setups discussed earlier. Those traders who are willing to risk can still bet on the market rising higher after moving above the resistance or moving lower after falling below the support. While this strategy will not predict the market moves correctly all the time, there is still a reasonable chance that there will be more wins than losses.
Another issue is that this strategy provides an entry point but cannot suggest an exit point. To decide on the option duration, you should use other indicators.
Using Countdown
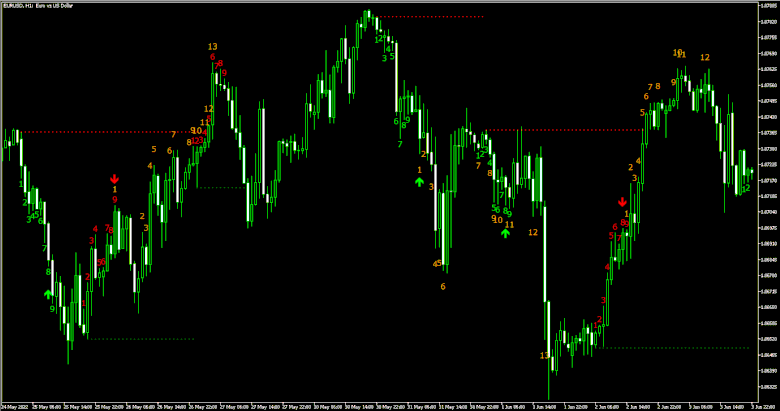
After completing the Setup, TD Sequential starts a Countdown. It is usually considered to be the most reliable part of the indicator. After reaching bar 13 of the Countdown, prices should start moving in the opposite direction. This means you can bet on the market moving to the downside if the Countdown completes after the Sell Setup and on the market moving to the upside if the Countdown completes after the Buy Setup. But is this really the case? This hourly chart of EUR/USD shows a clear example of when it is not the case:
Here one Buy Countdown completes only for another one to start almost immediately. Yet, despite this and several perfected Buy Setups in a row, prices continued to move down, ignoring all the signs of a trend reversal. Betting on the Countdown showing you the bottom of the present trend would be a total disaster.
While this is just one example, looking at other charts and time frames you will often see a similar picture. Overall, the TD Sequential Countdown looks to be very unreliable, and it is inadvisable to use it in trading binary options.
Using TD Sequential indicator with In/Out binary options
The previous chapter discussed using the TD Sequential indicator with the rather simple Up/Down binary options, which bet on the market moving in a particular direction. But what about the In/Out binary options, which bet on the market either ending inside or outside of a particular price range or if the market stays inside or goes outside the range during a set period?
The only part of the TD Sequential indicator that seems applicable in this situation is the support and resistance levels. In theory, they create a range inside which prices move for the most part. And that should allow traders to bet that prices stay inside this range. Alas, the practice proves this theory wrong. Just look at two examples.
Here is the daily chart of GBP/USD:
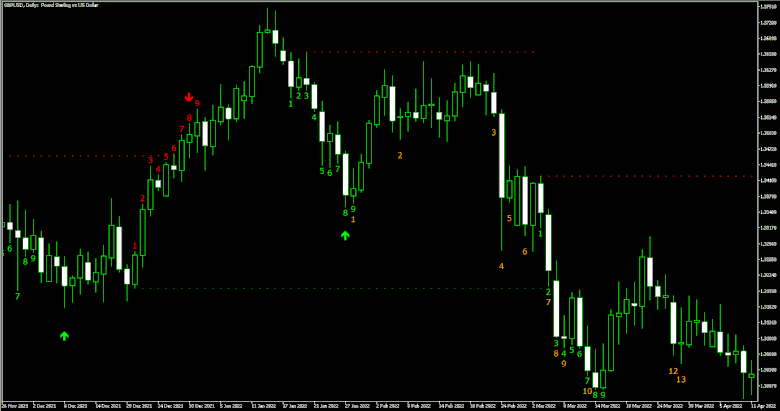
As you can see, prices break the initial resistance level without acknowledging it. The start of the rally created a support level, which prices also completely ignored.
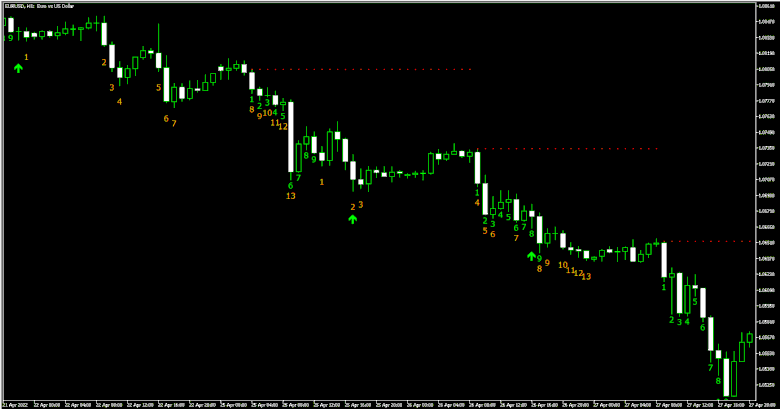
And here is the hourly chart of EUR/USD:
What is especially interesting here is the fact that in two separate instances the support and resistance levels created almost the same range. That suggests the support and resistance levels should be extremely strong and prices should have a hard time breaking it. Yet in practice, prices jumped above the resistance with ease. The support fared better as prices largely respected it. Yet still, they were trading below the support level for a short while.
The above examples show that support and resistance levels of TD Sequential are rather unreliable and should not be used to bet that the market will stay inside the range defined by those levels. Some people may argue that on the EUR/USD chart prices were trading inside the range between the support and the resistance than outside it. Indeed, traders willing to tolerate higher risk can bet on the market ending inside the range. It seems to be safer to bet on such an outcome if the price is currently far away from the bounds of the range. Though you can also make such a bet if the price successfully tested the support or the resistance, meaning that the price came close to or even touched the bounds of the range without breaking them. But you will still need other indicators to set the expiry date of the option.
You can download TD Sequential Ultimate indicator to use in your binary options trading completely free.