
The DeMarker Indicator
Today we discuss yet another technical indicator used by professional binary options traders in reading market sentiment and making better trades. These indicators, as we have known to be common in many charting and trading platforms can be very useful in creating signals that traders use as action points. When binary options brokers show the price of a certain asset to be doing something, it will surely be seen in these indicators.
One of the lesser known indicators that many binary options traders use is the DeMarker Indicator. The DeMarker indicator is simply an indicator that is used in technical analysis that compares the most recent price action to the previous candlestick’s action, attempting to measure whether or not there’s a substantial amount of demand for the specific asset. The DeMarker indicator is often used to identify if there is a chance of price exhaustion as well.
Interestingly enough, the DeMarker Indicator is also known as, or part of the DeMark Indicators formulated by Thomas DeMark, who is the founder and CEO of Market Studies, LLC, and whose name is used to identify the indicators. He has also been a special consultant to Steven A. Cohen of SAC Capital Advisors for over 15 years. These and other successful ventures make him and his work very influential in the field of finance and trading.
What the DeMarker Indicates
The DeMarker indicator is generally used to identify price exhaustion and can also be used to identify market tops and bottoms. The DeMarker indicator is an oscillator, that is bounded between -100 and +100, unlike many oscillators that go from 0 to 100. And, unlike many other oscillators, it does not use smoothed data. Some trading platforms however, provide mechanisms in their algorithms to provide some level of smoothing.
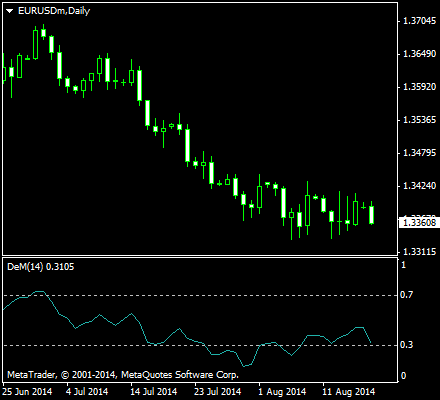
However, technical binary options traders primarily use this indicator as a method of identifying the riskiness of the levels in which they wish to place a transaction. Generally, values above 60 are indicative of lower volatility and risk, while a reading below 40 is a sign that risk is increasing. These values could vary from trader to trader. It also varies depending on the type of asset, and the future fate on the asset based on unfolding events.
Computation of Indicator Points
Because the DeMarker Indicator is based on the comparison of the maximum values of the current and previous periods, candlesticks can provide a more convenient manner of analyzing the indicator. Such is implemented in MLQ4, or MetaQuotes Language, the language used by the MetaTrader 4 and has a robust community online. The have created an algorithm based on the comparison that the DeMarker indicates.
The algorithm is as follows: If a current period or bar’s maximum is higher than the previous bar, then the respective difference between the two will be registered. However, if the current maximum is lower or equaling the maximum of the previous period’s bar, there will be a value registered which they called the naught value will be registered. In pseudocode format, these relationships can be defined as such:
Calculating DeMax:
If High(i) > High(i — 1), then DeMax(i) = High(i) — High(i — 1), otherwise DeMax(i) = 0
and calculating DeMin:
If Low(i) < Low(i — 1), then DeMin(i) = Low(i — 1) — Low(i), otherwise DeMin(i) = 0 The differences received for N periods are then summarized. The received value is used as the numerator of the DeMarker and will be divided by the same value plus the sum of differences between the price minima of the previous and the current periods or bars. If the current price minimum is greater than that of the previous bar, the naught value will be registered. Hence, the value of the DeMarker is computed as: DeMark(N) = SMA(DeMax, N) / (SMA(DeMax, N) + SMA(DeMin, N)) where SMA is the Simple Moving Average and N is the number of periods used.
Overbought and Oversold
When Tom DeMarker designed the indicator, he did it with detecting new quality trading opportunities in mind. He incorporated concepts into the indicator, which were primarily intended to overcome the many problems associated with analyzing overbought and oversold market conditions prevailing at that time. Many indicators are computed comparing at least two points in a price action movement, DeMarker is no different.
When the indicator falls below 30, there is an oversold condition and a bullish price reversal should be expected. When the indicator rises above 70, there is an overbought condition and a bearish price reversal should be expected. And it is the same with most other indicators that we have seen so far, the Stochastic Oscillator, Relative Strength Index, and other helpful indicators used to determine overbought and oversold conditions or regions.
A trader can almost always specifically utilize the DeMarker Indicator to aid in the detection of
The binary options trader should then be able to verify a price starts declining at that point by entering a new bearish trend. Consequently, such conditions present good opportunities to execute new short trades. The DeMarker Indicator has acquired an impressive reputation at detecting such price patterns under all types of market conditions. Many binary options traders are able to take advantage of this reversal, which results in successful trades.
You too can try the DeMarker Indicator, when you start trading binary options. Choose from the list of our recommended brokers that we have compiled in order for you to start trading today.