
Renko Charts
In financial markets, some traders have to consider the time or volume of their trades, whereas some find it possible to trade based on the price changes alone. This concept is the very foundation of Renko charts, in which time and volume have no role, and only price action is considered. By this characteristic, Renko charts can be likened to Point and Figure charts and Three Line Break charts, but rather than using X- and
As mentioned above, Renko charts disregard time in its use. Instead, these charts only consider price movement, which makes them very challenging for some traders, most of whom are used to trading the
History and Characteristics of Renko Charts
The Renko chart is invented by Japanese traders. Legend has it that in Feudal Japan, an old bricklayer set colored bricks on top of plain ones by accident. From this incident stemmed the concept of the Renko, or Renga (literally bricks in Japanese). It was Steve Nison in the US, however, who actually popularized Renko Charts in his book, Beyond Candlesticks. Renko charts have been used for quite some time now, and people have traded quite successfully using the tool, despite the unfamiliarity and the discomfort that it brings with its simplicity.
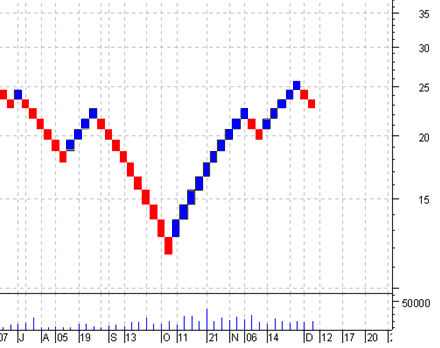
In his book, Nison devotes an entire chapter to Renko charts. Renko candles are described look like small bricks or boxes. They have no upper or lower shadows, and the box size can be changed. A new box will appear on the chart only when a defined level of price change occurs. If the box size is set to a smaller value, then new boxes come faster. Conversely, if the size is set to a higher setting, then a larger price change is needed to produce a new box on the chart. An example of a Renko chart is shown below:
Calculation of Renko Charts
Because time, volume, and direction are disregarded, and because only the change or movement in price is considered, elements of the Renko chart must be simplified to a single price level. This price level is based on the closing price. A “box size” is specified to determine the minimum price change to affect any significance that will be displayed on the chart.
In drawing Renko boxes or “bricks”, the closing price for today is compared with the highest price and lowest price (blue and red) of the previous brick. On the one hand, if the closing price rises above the top of the previous brick by a value that is greater than or equal to the box size, then one or more blue bricks are drawn in the next column. On the other hand, if the closing price falls below the bottom of the previous brick by a value that is greater than or equal to the box size, then one or more red bricks are drawn in the next column. The height of all bricks drawn is always equal to the box size.
If the price moves up or down by more than the
Adding and Using Renko Charts to MetaTrader
To add Renko Charts to MetaTrader, Renko files (including .ex4 and .mq4 or .mq5 files) need to be downloaded and extracted to the MetaTrader installation folder of your machine. For MetaTrader 5, the files can be downloaded here (http://www.mql5.com/en/code/1299). Afterward, MetaTrader is restarted, and the chart where the Renko bricks are to be applied is selected.
The following shows a snapshot of EUR/USD using Renko on MetaTrader 5:
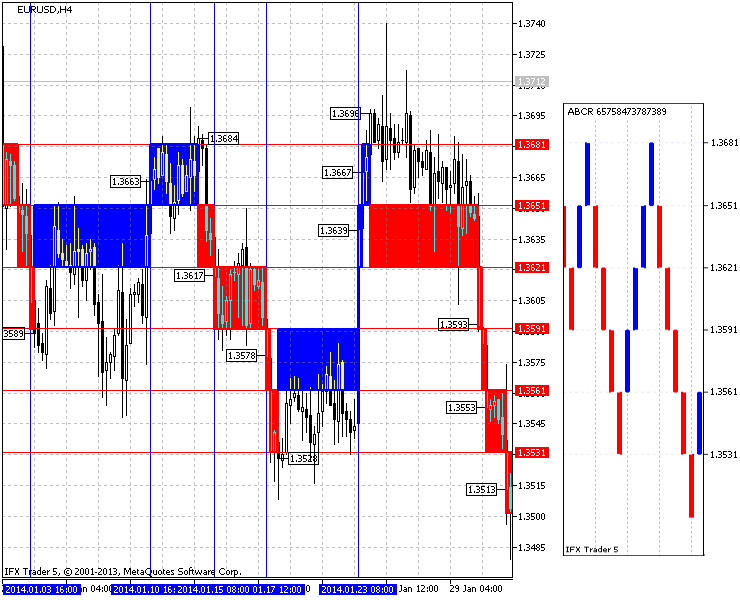
(courtesy: www.mql5.com)
As mentioned previously, a standard Renko chart is based on the closing price. To set up Renko, the timeframe and the box size are first selected. In the sample snapshot above, the EUR/USD adopts the 4-hour timeframe and a 30-point box size. The resulting Renko chart shows levels from 1 January 2014 to 31 January 2014 (1 month). The left portion of the image above shows the charting of the given timeframe, and the right portion shows the Renko chart.
Taking a closer look at the chart, we see that red horizontal lines represent the size of each brick according to the fall in price (30 points). The blue areas represent the dates with increasing price levels.
As seen after 1 January 2014, a candlestick closes at 1.3589 (marked with the
After this period, the price becomes stagnant (not closing below 1.3561 or above 1.3651). On 10 January 2014, the candle opening at 20:00 (after the candlestick at 16:00 closes) closes at 1.3663, which is above the 1.3651 price mark. Afterward, the price again becomes stagnant until 20:00 of 14 January 2014 (after the candlestick that opened at 16:00 closes), when it overcomes the price range by creating a new brick that closes at 1.3684.
Then, a downtrend is witnessed where the price breaks through four range levels on the chart during its decline. At 12:00 of 23 January 2014, when the candlestick that opened at 08:00 closes, an upward breakthrough of the price range is seen, which in turn opens two bricks that close at 1.3639. The first brick is clearly visible, whereas the second one is pulled in a long vertical line (because of its simultaneous opening with the first brick).
Renko Charts and Binary Options
Binary options traders use Renko charts because they are easy to use and interpret. These charts are also different than a typical candlestick chart because they filter out all other variables besides price movement. Cancelled noise from the market means that a trader can clearly make his decision based on a major factor. Many applications use Renko charts, including binary options trading. Through Renko, basic support and resistance levels, breakouts, generating signals, and other indicators are discovered and applied for more profitable trades.
One strategy is to build around momentum, which means that the price moves in the trade direction, making it quite important for assessing the probability of risk. Renko systems can effectively find areas of high and low volatility and can let traders know when to make CALL and PUT options. Generally, in times of high market volatility that has a direct correlation with the direction of the price, a CALL option is made when the Renko shows a strong uptrend (more blue bricks). Conversely, a PUT option is made when the Renko continuously shows a strong downtrend (more red bricks). Make sure to test your strategies involving different timeframes and box sizes to obtain your most comfortable position.
Let Binarytrading.com provide you with more tips in the future. Stay tuned.