Heiken-Ashi Candles
by Kelly Cromley

Binary options and general traders always want a clearer way of validating the trueness of the strength of a trend in any direction. Popular indicators have sprung from techniques that smoothen out the trend lines. Top market analysts have devised numerous ways to look at how the price of a certain asset moves in spite of distorting factors such as volatility and volume. When market analysis requires pin-point accuracy in orders to profit, better tools are needed.
Candlesticks, as we have discussed, have the potential to achieve such goal. Heikin-Ashi (平均足) is a Japanese term that literally translates to “average bar”. These are also candlesticks, and like them, Heikin-Ashi are represented as bars. However, this type of candlestick depicts the weighted-average values resulting from the levels of a normal candlestick. This version provides a clearer view that any trader needs.
Since this type of candlestick shares many characteristics with standard candlesticks let us recall what a candlestick refers to so that we can relate these properties to Heiken-Ashi. Candlesticks show the four relevant price levels for a trade period, that is, the open, low, high, and close. Open and close are the opening and closing prices while high and low are the highest and lowest levels that the price reached during the duration of the trades.
However, regular candlesticks differ from Heiken-Ashi in one major aspect. The values used to construct each bar of the Heiken-Ashi candlesticks are derived differently. Instead of using the open-high-low-close (OHLC) bars like regular candlesticks do, the Heikin-Ashi technique uses a modified formula that depicts the statistical distribution of the price levels during the trade. In other words, the OHLC values are interrelated to get the weighted-average of each value.
Calculation of HValues
Let us look closely on how the values for OHLC are manipulated to get the numbers that will build our Heiken-Ashi candles. There are four formulas, each pertaining to the weighted average of the open, high, low, and close prices of a certain asset. Notice that two of the formulae are actually average equations, showing the Heiken-Ashi shows the average values for a trade. Here are the formulae used for the derived, averaged values for OHLC.
- HOPENcurr = (HOPENprev + HCLOSEprev) / 2
- HCLOSEcurr = (OPENcurr + HIGHcurr + LOWcurr + CLOSEcurr) / 4
- HHIGHcurr = MAX(HIGHcurr, HOPENcurr, HCLOSEcurr)
- HLOWcurr = MIN(LOWcurr, HOPENcurr, HCLOSEcurr)
Where:
- HOPENcurr: Current Heiken-Ashi Open
- HCLOSEcurr: Current Heiken-Ashi Close
- HHIGHcurr: Current Heiken-Ashi High
- HLOWcurr: Current Heiken-Ashi Low
- HOPENprev: Previous Heiken-Ashi Open
- HCLOSEprev: Previous Heiken-Ashi Close
- OPENcurr: Current Open
- CLOSEcurr: Current Close
- HIGHcurr: Current High
- LOWcurr: Current Low
- MAX: The maximum value in a given set
- MIN: The minimum value in a given set
The modified formulae show different interpretations when it comes to relating standard OHLC values of regular candlesticks with Heikin Ashi. The Heikin-Ashi Open is the average of the previous Heikin-Ashi candlestick open plus the close of the same previous Heikin-Ashi candlestick while Heikin-Ashi Close is simply an average of the open, high, low and close for the current period. These formulae show the average values of the previous and current candles.
Meanwhile, the Heikin-Ashi High is the maximum value among three data points: the current period’s high, the current Heikin-Ashi Open or the current Heikin-Ashi Close. Conversely, the Heikin-Ashi low is the minimum value of the same three data points except one where the current period’s high is replaced with the current period’s low. These values show the maximum and minimum values of prices according to the average values and that period’s high or low.
Interpretation
Many traders use the Heiken-Ashi to identify a trend more easily. In most cases, profits and losses occur during trending markets. The Heiken-Ashi can be very helpful in taking advantage of these profits in a way that traditional candlesticks sometimes cannot accomplish. Unlike regular candlesticks, Heiken-Ashi has the ability to filter out small changes, and give traders a clearer picture of the market. Depending on whether a trend is bearish or bullish, the candles can be read accordingly.
Top finance experts at Investopedia discuss five ways of identifying whether to purchase Call or Put options.
- Hollow candles with no lower “shadows” signify a strong uptrend.
- Hollow candles usually indicate an uptrend.
- One candle with a small body occupied by upper and lower shadows indicates a trend change: Some traders look for a call/put option here, while more careful traders would wait for more confirmation.
- Filled candles indicate a downtrend.
- Filled candles with no higher shadows usually identify a strong downtrend, and indicate a put option. The opposite applies for a call option.
These signals make it easier to identify trends and other opportunities. When trends are identified, Heikin-Ashi shows a strong truth about the trend. It is often reliable and they are not that disrupted by false signals.
Pros and Cons of the Heikin-Ashi
Using Heikin-Ashi makes reading candlesticks much easier. Trends are easier to identify, and call/put options can often be spotted at a glance. When properly used, this indicator can help traders identify trends and trend changes to maximize profit from the right actions. Heikin-Ashi cleans up the price movement and eliminates distortion and noise. Uptrends and downtrends are clearly shown. An example of this can be seen below, courtesy of stockcharts.com
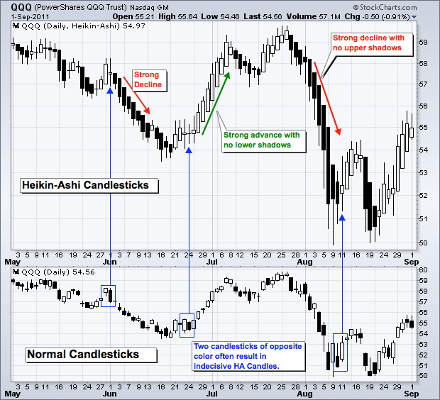
From stockcharts.com
As long as the color of Heiken-Ashi candles remain the same, traders can count on their trades to be going in the right direction. Because the candles are interrelated through the formulae we’ve discussed above, they offer a much cleaner view of price action and are not just a standalone representation of price that are depicted by traditional candlesticks. Most charting platforms already have Heiken-Ashi as an indicator, which many traders find very convenient.
However, there are also things that traders should look out for when using Heikin-Ashi. Traders are still advised to combine the information brought by the Heikin-Ashi with other indicators to avoid falling for false signals. In addition, the Heikin-Ashi is not a leading indicator, so it does not react to exact price changes. Aside than these two major disadvantages, many traders have found the other disadvantages to be negligible enough to make this indicator work for them.
Setting up Heiken-Ashi in MetaTrader
MetaTrader 4 and MetaTrader 5 platforms that are often used by binary options traders for technical analysis can easily display Heiken-Ashi charts. A trader has to follow the precise list of steps to get the HA chart working in MetaTrader:
- Press F8.
- Change Line graph color to None.
- Switch to Common tab.
- Remove mark from Chart on foreground (if it was set).
- Switch the chart to Line chart.
- Click OK button.
- In the menu, go to Insert→Indicators→Custom→Heiken Ashi.
- Click OK button.
Try using Heiken-Ashi today. Check out our list of binary brokers so you can start trading and implement your strategies.
