
Commodity Channel Index
It is important to include such indicators in any charting platform that we use in order to make better sense of the raw price data that is being displayed in the charts. These raw data which are seemingly impossible to read without the help of oscillators, build up data points at which indicators are created. These indicators are what binary options traders look into when hoping to successfully trade binary options.
The Commodity Channel Index, commonly termed as CCI is an oscillator indicator used by binary options traders in identifying trends, not only in commodities, but also equities and currencies. This tool used in technical analysis also helps traders determine whether an investment vehicle has been overbought and oversold. CCI quantifies the relationship between the asset’s price, a moving average of the asset’s price, and normal deviations from that average.
History of the Commodity Channel Index
The Commodity Channel Index was originally introduced by Donald Lambert in a published article in the October 1980 issue of Commodities magazine, which is now known as Futures magazine. Since the introduction of CCI as an effective indicator, it has grown in popularity and is now a very common tool for traders in identifying cyclical trends in many underlying assets that are used in trading. The Commodity Channel Index can actually be adjusted to the timeframe of the market traded on by changing the averaging period.
The CCI has seen substantial growth in popularity among technical investors. Today’s binary options traders often use the indicator as they use any other popular indicator used in technical analysis. CCI is also used as a tool to signal overbought and oversold conditions that lead to easily interpreted buy and sell signals. When traders know that a price is in the overbought or oversold regions, they can make accurate predictions about the movement of a price and make the right trades accordingly.
Using CCI with Other Oscillators
The CCI, when used in conjunction with other oscillators such as the Stochastic Oscillator or the Relative Strength Index, can be a valuable tool to identify potential peaks and valleys in the asset’s price. The Commodity Channel Index can thus provide investors and traders with reasonable evidence to estimate changes in the direction of price movement of the asset. When traders are provided with the right information, they are able to make more successful trades.
When Donald Lambert developed the Commodity Channel Index, he based his design on the concept that commodities, stocks and currency pairs always advanced in cycles with lows and highs arriving at periodic intervals. Consequently, a trader can best use this indicator to assist him in detecting these cyclical movements on the financial markets. Knowing when a price is about to hit a high or a low region is crucial in knowing the next set of movements that a price will take.
Calculation of CCI
The Commodity Channel Index measures the variation of an asset’s price from its statistical mean. This means we are getting the relative location of a current price value in relation to how volatile the price action has been historically. High values show that prices are unusually high compared to average prices whereas low values indicate that prices are unusually low. Again, let us remind our readers that contrary to its name, the CCI can be used effectively on any type of asset, and not just commodities.
The index is calculated as the difference between the typical price of an asset and its simple moving average, divided by the mean absolute deviation of the typical price. The index is usually scaled by an inverse factor of 0.015 to provide more readable numbers.
CCI = (1 / 0.015) * ((Pt — SMA(Pt)) / σ(Pt))
where SMA is the simple moving average, σ is the mean absolute deviation, and Pt is the Typical Price computed as such.
Pt = H+L+C3
where H is the high price, L is the low price, and C is the closing price.
For the purposes of scaling, Lambert has set the constant at 0.015 to ensure that approximately 70 to 80% of the values obtained for CCI −100 and +100. This means that CCI can fluctuate above and below zero. The percentage of CCI values that fall between +100 and −100 will be dependent on the number of periods used for the analysis. Having lesser periods will cause the values to be more volatile with a smaller percentage of values between +100 and −100. Conversely, the more periods used to calculate the CCI, the higher the percentage of values between +100 and −100.
To summarize the calculation, the CCI can be computed using the following steps:
- Get the typical price by adding each period’s high, low, and close and divide this sum by 3.
- Calculate an
n-period simple moving average of the typical prices computed in the previous step. - For each of the prior
n-periods , subtract today’s SMA value from the typical price value n days ago. For example, if you were calculating a 3-day CCI, you would perform three subtractions using today’s SMA value. - Calculate an
n-period simple moving average of the absolute values of each of the results in Step 3. - Multiply the value in Step 4 by 0.015.
- Subtract the value from Step 2 from the value in Step 1.
- Divide the value in Step 6 by the value in Step 5.
Interpretations of CCI
Binary options traders use the commodity channel index to help identify price reversals, price extremes and trend strength. As with using most indicators, this index should be used in conjunction with other aspects of technical analysis. CCI can be considered as a momentum oscillator. In addition to momentum, CCI can also indicate trading volume and other technical assessment parameters. Traders should be able to use CCI to find out market sentiment as shown in the charts.
CCI is also often used to detect divergent movement from price trends as an overbought and oversold indicator. The index allows traders to draw patterns on it and trade according to those patterns. The CCI is therefore quite similar to Bollinger Bands in this respect. But CCI is presented as an indicator, rather than depicting overbought and oversold levels. Still, traders use this information the same way, where overbought levels tend to make a reversal to the downtrend, and oversold levels tend to make a reversal upward.
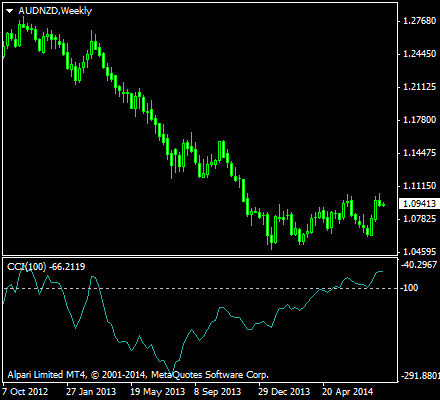
The CCI typically oscillates above and below a zero line, meaning normal oscillations will occur within the range of +100 and −100. Readings above +100 imply an overbought condition, while readings below −100 imply an oversold condition. As with other overbought/oversold indicators, this means that there is a large probability that the price will correct to more representative levels. Binary options traders can now make an accurate prediction based on what the current CCI is telling them, and can make the appropriate trades for maximum profit.
Here is a summary of the signals provided by the Commodity Channel Index, and what action to take when the following are noticed:
Commodity Channel Index Buy Signal
Commodity Channel Index (CCI) is below oversold line (-100).
CCI then crosses above the oversold line.
Commodity Channel Index Sell Signal
Commodity Channel Index (CCI) is above overbought line (+100).
CCI then crosses below the overbought line.
We have more indicators that you can use to optimize your trading techniques. Stay tuned as we have more in store for you. In the meantime, why don’t you check our list of top binary brokers to get you started with trading?