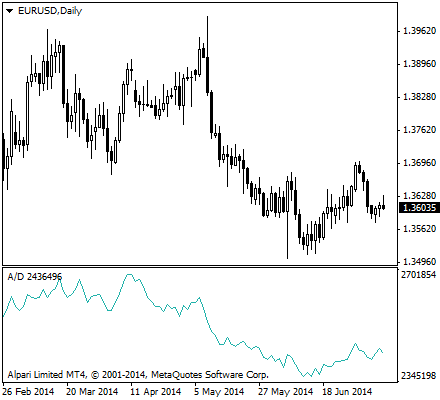
Accumulation Distribution Line (ADL)
In our other articles we talk about the importance of knowing the volume of a trade for a certain period of time. Relating it to a microeconomic example, consumers are more inclined to participate in a business where many transact with. Volume shows trust and strength but can also mean demise when high volume depicts preparation for a stock’s downfall. The OBV or
Another technical indicator involving the property of volume in trades is the Accumulation Distribution Index. This indicator is used as a much more featureful version of the
The Accumulation Distribution Index, also known as the Accumulation Distribution Line or ADL, is a
ADL was developed by Marc Chaikin, a stock analyst and CEO of Chaikin Stock Research, LLC. Because the indicator involved the summation of money flow, Chaikin originally called it the Cumulative Money Flow Line. An oscillator based on this indicator called the Chaikin oscillator is produced by subtracting a 10-day exponential moving average from a 3-day exponential moving average of the accumulation/distribution index. The Chaikin oscillator, being a
Close Location Value (CLV)
In obtaining for the points that make up the Accumulation Distribution Line, first we need to have a multiplier that is calculated based on the relationship of the close price of an asset to its
The following is the calculation for CLV:
CLV = (close — low) — (high — close) / (high — low)
CLV is used to spot the tendency in the price movements. It is used as a measure in technical analysis to determine the “closest location” as a “value” where the price closed. The close location value is used in many indicators, but is most commonly known for its role in the calculation of the ADL. However, CLV can stand alone. For example, when the CLV and a stock price form a positive divergence, a bullish signal is considered, and vice versa. Also, when the CLV is crossing the zero line, a positive CLV is considered bullish, and vice versa.
The CLV ranges between +1 and -1, where a value of +1 means the close is equal to the high and a value of -1 means the close is equal to the day’s low. The implementing the Close Location Value into other technical indicators like the Accumulation Distribution Line is becoming more popular because it is often regarded as a better measure for the period’s activity than relying solely on the closing price. Furthermore, having a CLV as a determinant for other indicators gives an edge when it comes to bringing out the true market sentiment.
Calculation of ADL Points
After calculating the CLV, the next step to obtaining the current ADL point is to multiply the CLV by the period’s volume and add the result to the previous point of the Accumulation Distribution Line. The second equation given below demonstrates formula. The CLV formula is restated to completely show the steps in obtaining the ADL. Again, the CLV ranges from -1 when the close is the low of the day, to +1 when it’s the high. For instance if the close is 3/4 the way up the
CLV = (close — low) — (high — close) / (high — low)
ADL = ADLprev + Volume x CLV
The ADL adds up volume multiplied by the CLV factor, that is, ADL = ADLprev + Volume x CLV. The starting point for the ADL, or the zero point, is arbitrary. Only the shape of the resulting indicator is used, and not the actual level of the total. Because the high, low, and close values change every trading period, a new CLV is constantly produced, showing significant changes in the ADL as well. It is these changes that binary options traders need to look out for in correctly interpreting this indicator.

Interpretation of the ADL
The name Accumulation Distribution comes from the idea that during accumulation, buyers are in control of the trades, and the price will be bid up throughout the day. It can also make a recovery if sold down. In either case, trades more often finish near the day’s high than the low during accumulation. A positive volume or money flow can be considered for this half of the indicator. Bullish strategies may therefore be applied.
The opposite applies during distribution. Sellers distribute, supply is up, and prices go down. Because of the duality of the indicator, it is quite similar to On Balance Volume. However, ADL is based on the closing price of the day’s range, instead of the
A high positive CLV combined with high volume shows strong buying pressure that pushes the indicator higher. Conversely, a low negative CLV combined with high volume reflects strong selling pressure that pushes the indicator lower. The volume that accumulates to form the ADL either confirms or contradicts the underlying price trend. Because of this, ADLis used to either reinforce the underlying trend or cast doubts on its sustainability.
Chartists can use this indicator to affirm a security’s underlying trend or anticipate reversals when the indicator diverges from the security price. An uptrend in prices with a downtrend in the ADL suggests underlying selling pressure, or distribution, that could foreshadow a bearish reversal on the price chart. A downtrend in prices with an uptrend in the Accumulation Distribution Line indicate underlying buying pressure, or accumulation that could foreshadow a bullish reversal in prices.
Learn more indicators as we continue to teach you how to use them in successfully completing your trades. Check out our list of preferred binary options brokers that you can start an account with and earn rewards and bonuses.

