
Using Inside Bars in Binary Options Trading
We would like to continue to help new binary options traders get started with trading by providing helpful tips in both fundamental and technical analysis. Today, we will digest a binary options strategy that is based on a certain formation of candlesticks that traders need to look out for. We have also discussed the importance of knowing how to read candlesticks in stock charts, as well as the various indicators that can be used to get a better view of the current situation of the market.
The strategy that we will be discussing today is called the inside bar candlestick formation. This candlestick pattern is used to identify significant reversals in the directional price movements of assets. Basically, if a binary options trader can learn how to detect inside bars during overbought conditions, then he will be able to detect good selling opportunities, and therefore know the best time to make a put option. Conversely, the occurrence of an inside bar during oversold conditions often presents quality opportunities to execute new call binary options.
Overbought and Oversold
We have briefly touched on these concepts when we were discussing stochastic oscillators. Overbought regions are found at the top peak or crest of trends while oversold regions are those areas that are found at the bottom or troughs. But what do they denote exactly? This section analyzes both these conditions, but we will be going back to these concepts to discuss a strategy of their own in another article.
Overbought is a situation wherein the demand for a certain asset pushes the price of the asset to levels that are not confirmed in fundamental analysis. Using technical analysis, overbought describes the situation where the price of an asset has gone up to a very high level, usually on high volume, that an oscillator indicator has reached its upper bound. This is usually interpreted as a sign that the price of the asset is becoming overvalued and may experience a pullback, resulting to a new downtrend.
Overbought on the other hand, is a condition in which the price of an underlying asset has decreased drastically to a level below its true value. The overbought condition is usually a result of market overreaction or panic selling. In technical analysis overbought is when the price of an asset has fallen greatly, usually on high volume, that an oscillator indicator has reached a lower bound. This is usually interpreted as a sign that the price of the asset is becoming undervalued and may represent a buying opportunity for investors, creating a new uptrend.
What Is an Inside Bar?
Various methods of grading trends such as identifying support and resistance, as well as looking for potential entries based on individual candle formations are all indicators of what the price is doing at a particular trading period. The inside bar candlestick formation can also help the binary options trader find potential trading ideas, but this pattern is different in the sense that it is more about what prices are not doing as the candle is forming.
The Inside Bar is a common candle formation that only requires two candles to form. The inside bar denotes a direct play on
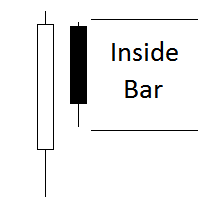
A figure shows a bearish inside bar, where we can see a pattern consisting of a
Another good point of information whenever using inside bars as a trading strategy is the trading period involved. When a binary options trader uses inside bars, he must know that the occurrence of this pattern is used best when trading charts based on larger time frames from the hourly upwards. Excessive noise tends to diminish the effectiveness of using this strategy when lower
How to Trade Using Inside Bars
Binary options traders can easily exploit the benefits of the inside bar strategy. Some new traders look to trade inside bars as reversal patterns, just like Doji. They hypothesizing that after price has trended up, or down for an extended period of time, the “pause” in price’s movement as represented by an inside bar precedes a reversal of the trend. With this in mind, binary options traders use the inside bar for a
Another way to play inside bars is to dig deeper into what the inside candle represents from our definition of how they are formed. When a trader sees an inside bar form on the charts, he sees a high price and a low price that is inside of the high and low of the day before. This can be thought of as a trader’s unwillingness to push price higher or lower for any number of reasons. Perhaps an extremely pertinent press release is to be issued soon, or perhaps the market had just made a stratospheric leap and traders are tepid about bidding price much higher or lower.
However, when traders look at inside bars, their purpose is the same. This purpose is to show traders that there is a potentially high volatility in the next succeeding trades, and for traders to make the right move to minimize loss or gain a substantial amount of profit. When there is a situation wherein traders are unwilling to bid price higher or lower, there is also a potential situation for future increases in volatility. To binary options traders, this means opportunity.
We have more helpful articles in store to make sense of the various indicators and chart patterns used by experienced binary options traders. You can practice with these strategies using free demo accounts of one of the top binary options brokers we have provided. Once you are confident, you can start trading with a live account. Start trading binary options today.