
Support and Resistance in Binary Trading
In trading binary options, the binary options trader will constantly be looking at charts denoting uptrends and downtrends of each of the assets that they have chosen to trade in. Binary options brokers provide the right tools in order for traders to make the best decisions in their trades. Every indicator plays an important role if the binary options trader wants to make a successful trade every time. Learning how to read these indicators and knowing market sentiment is the best way to successfully trade binary options.
As many of us already know, the price of a financial instrument are affected by many market forces at play. But, the price of an asset is ultimately determined by supply and demand. Very simply, if the demand of a financial instrument is increasing relative to the supply, then price will rise. Conversely, if the demand for a particular asset is decreasing relative to the supply, then price will fall.
As we have determined in the previous articles, what we are basically looking at when we see an uptrend on the chart is a period of time when demand has continuously increased in relation to supply. Again, conversely, what we are looking at when we see a downtrend on the chart is a period of time when the demand has continuously decreased in relation to supply. What support and resistance is all about is when the price levels at which demand and supply equations reverses itself and prices are expected to stop moving in the direction that it was moving before and potentially reverse itself.
Support and Resistance Lines
Support is defined as the price level of a particular asset where there is enough demand should the price reach that level to keep prices from falling further. Resistance on the other hand is the price level of a particular instrument where there is not enough demand should the price reach that level to keep prices from rising further.
Here is an example of an excerpt of a price chart of a certain asset where support levels is shown as the black line where reversals have happened from a downtrend to an uptrend.
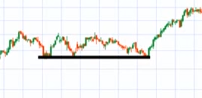
From the figure, we can see that the price has touched that level several times, three times to be exact, and then it has never touched it again. A support level that is held is what it is called.
The same example shows a black line, this time showing the resistance level of the price of the asset, where reversals have happened from an uptrend to a downtrend.
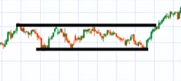
The price has touched the resistance line three times, enough to establish a resistance line. You will also notice that the third reversal from a downtrend to an uptrend was not held by the resistance line during this period, as seen by the price level breaking through the resistance line and continuing to trend upwards.
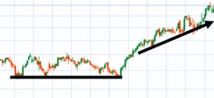
Support and resistance lines do not necessarily have to horizontal. As we have learned about trends in the previous articles, trendlines can actually be support or resistance lines denoting the trend in the market. While horizontal support or resistance lines denote
Here we see an uptrend where the price touches the support line several time before eventually breaking down to a downtrend lower than the support line. Support points are the lowest points reached before each recovery of the binary option asset upward. Conversely, a resistance line can be shown as such.
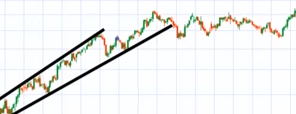
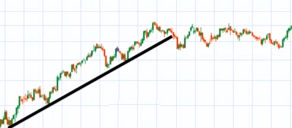
In the figure above, a resistance line is drawn from the same excerpt showing the price touching the resistance line several times. This line is acting as a resistance to the uptrend. We can think of it as a boundary of the price preventing it from rising even more. To define the resistance points, just take the highest point reached just before the price begins to drop. Each upward peak represents a resistance point.
Binary Options Strategies using Support and Resistance
A common strategy that binary options traders use is to know when to choose call or put options based on the resistance lines. Generally, put options are purchased when a price tends to touch a resistance line where reversals from uptrends to downtrends are imminent, and call options are chosen when a price tends to touch a support line where reversals from downtrends to uptrends can easily happen.
Binary options traders know that a market, no matter how stable, experiences fluctuations throughout a day of trading, whether they are upward or downward. According to its peaks, traders are able to define what are the support points and resistance points. This makes binary options trading effective and successful.
Support and resistance points are not exact numbers, rather estimations. Nevertheless, most of these estimations are often proven correct, if not to say accurate, in terms of showing the relative price levels where reversals from a downtrend to an uptrend, and vice versa. Knowing these points will therefore allow you to achieve successful binary options transactions.
The trader will see the price of the binary option asset surpass the support or resistance prices. One will naturally think that these prices are useless. Patience and attentive observation of the next movements is crucial. The trader should note that the asset price has returned to the support or resistance level, and that this is only a simple reflex or false alert from the market.
Learn more from us. We have a complete line of help tips for every type of binary options trader. We also have a list of today’s top brokers. Check them out to start trading today.